New tool simplifies collection, integration, and querying of agrometeorological data

Digital tools are becoming the norm for informed decision-making in the entire agricultural sector. Many of these tools like crop prediction models and irrigation management scheduling require the use and integration of weather and climate data from multiple sources. However, integrating complex data sets continues to be difficult due to varying formats, data quality, and often different spatial and temporal resolutions. Developers and researchers spend significant time integrating multiple sources into one data set.
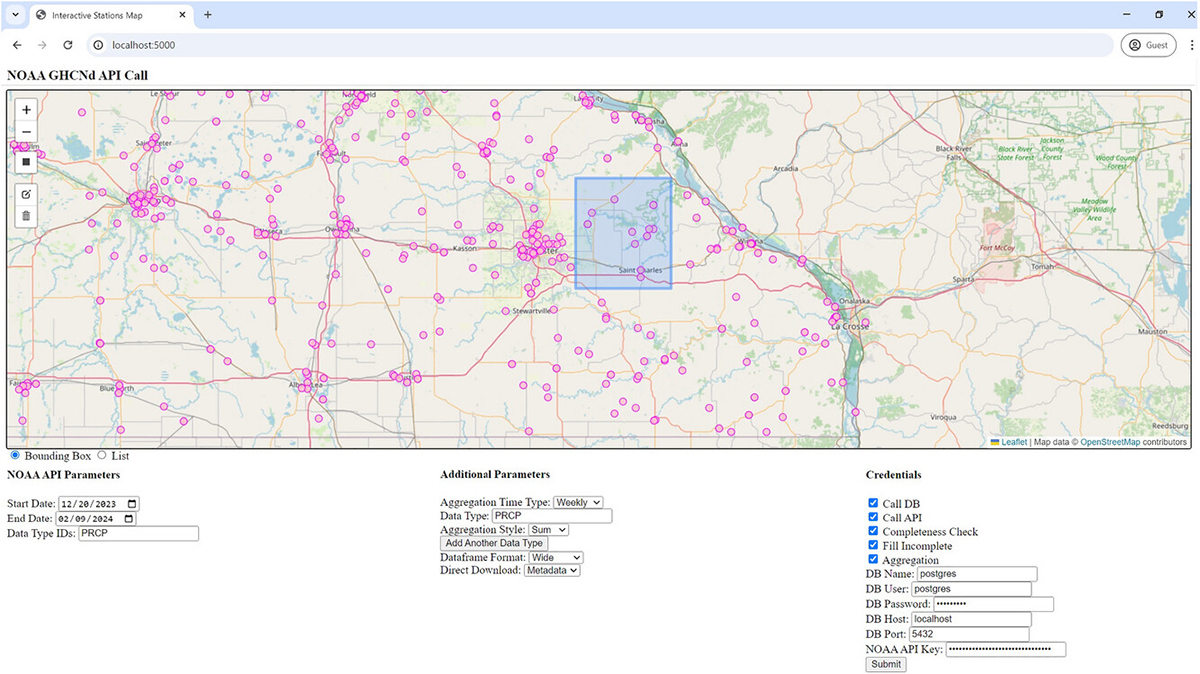
In a recent study, researchers developed a prototype tool that simplifies the process of collecting, cleaning, and integrating agrometeorological data. The tool aggregates information from NOAA’s Global Historical Climatology Network, NOAA’s Gridded Climate Normals, and Ameriflux BASE. It automatically updates and integrates new data, ensuring accuracy while reducing any redundant workflows. Users then can query and summarize data across various scales, tailoring a specific data set that is downloadable and ready for analysis—all in a user-friendly web interface or through the application’s application programming interface (API).
This tool and overall framework can make integrating high quality agrometeorological data more efficient and reliable. By simplifying this process, researchers will have access to complex read-to-use datasets, enabling them to tackle agricultural challenges more effectively.
Dig deeper
Gall, L., Glancy, T., Kantar, M., & Runck, B. C. (2024). A tool for integrating agrometeorological observation data for digital agriculture: A Minnesota case study. Agricultural & Environmental Letters, 9, e20147. https://doi.org/10.1002/ael2.20147
Text © 2025. The authors. CC BY-NC-ND 4.0. Except where otherwise noted, images are subject to copyright. Any reuse without express permission from the copyright owner is prohibited.


