Winter Wheat Historic Trends and Yield Gaps in the Wheat State


Wheat is the most widely grown grain crop in the world, with the United States ranking as the fourth-largest producer after China, India, and Russia. Kansas, known as "The Wheat State," is the top winter wheat-producing state in the country. However, a significant yield gap exists between potential winter wheat yields and actual farm-level averages in Kansas. Due to ongoing conflicts in major wheat-growing regions such as Ukraine and Russia, along with recent droughts, a record decline in global wheat stocks was anticipated. To better understand winter wheat’s economic contributions, production trends, and relationship with climate variability, data from annual winter wheat yield trials and USDA reports in Kansas were analyzed to study historic trends and correlations. Earn 0.5 CEUs in Crop Management by taking the quiz for the article at https://web.sciencesocieties.org/Learning-Center/Courses.
Wheat is the most widely grown grain crop in the world. The United States is ranked as the fourth major wheat producer after China, India, and Russia. Kansas is the top winter wheat-producing state in the United States, and contributes on average about 26% of total U.S. wheat production, and as such is nicknamed “The Wheat State” (Obembe et al., 2021; NASS, 2022). A significant yield gap has existed in Kansas between potential winter wheat yields and the actual farm level average yield (Lollato et al., 2017; Jaenisch et al., 2019).
Due to current conflict in the major wheat growing region of Ukraine and Russia and recent significant droughts, record decline in world wheat stocks was expected. Understanding winter wheat’s contribution to the economy, production trends, and relationship with climate variability will contribute to mitigating such impacts of environment on yield with early preparedness. To that end, data available in the state of Kansas through annual winter wheat yield trials and USDA reports were used to study winter wheat historic trends and relations.
Winter Wheat Productivity

Average winter wheat productivity in Kansas from the 1860s through the 1950s was 14 bu/ac (Figure 1). Average winter wheat productivity in Kansas increased to 22 bu/ac from 1960 through 1970 and averaged 37 bu/ac for the years between 1970 through 2022. Average irrigated winter wheat yield was 49 bu/ac for the years 1970 through 2022, increasing by 0.33 bu/ac/year during this period. Average non-irrigated winter wheat yield was 36 bu/ac from 1970 through 2022, increasing by 0.24 bu/ac/year (Figure 1).
Yield Variation Over the Years
Year-to-year variation in yield significantly increased in recent years (Figure 2). A visual and statistical analysis of the annual yield data indicated a decrease in variation for the years from 1866 towards the 1930s but then a significant increase in annual yield variability from the 1930s towards the 2020s (Figure 2). The annual variation increased from ±7 bu/ac in the 1930s to ±20 bu/ac in the late 2010s and early 2020s.

Factors Responsible for Yield Changes
The average yield for the years 1966 to 2022 was about 22 bu/ac with an 11 bu/ac standard deviation (Figure 3). Annual average winter wheat yield from the USDA prior to 1967 fell into either very low yield environment (VLY) or low yield (LY) environment categories (Figure 3).
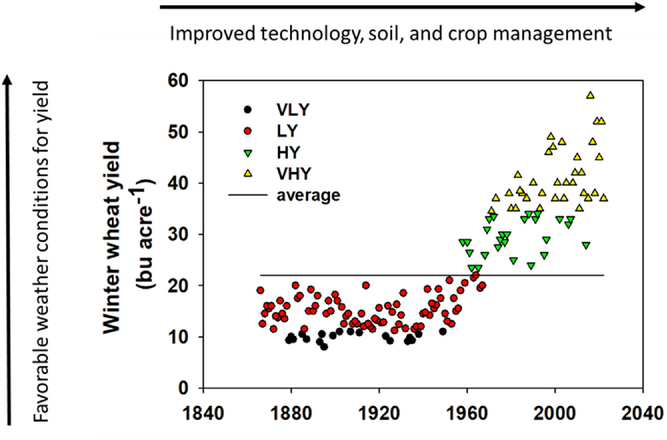
Both VLY and LY are below the average, but LY is within the standard deviation of average, and VLY is greater than one standard deviation below average. Yield reported by USDA after 1967 was either in high-yielding (HY) or very high-yielding (VHY) environments. For the years prior to 1967, we can assume VLY is the result of poor weather conditions in addition to poor technological advances, and LY is the result of better weather conditions despite poor technology adoption (agronomy and plant breeding). For the years after 1967, we can assume HY is the result of poor weather conditions despite technological advances, and VHY is the result of better weather conditions with improved technology.
Results showed that there was a 40–57% yield difference between VLY and LY or HY and VHY environments that can be attributed to the impact of weather conditions for USDA data, irrespective of technological advances. There was a 172–200% yield difference between VLY and HY or LY and VHY environments that can be attributed to technology and management advances from prior to 1967 to years after 1967. For the years from the 1850s to the present, the increases in yield were mainly due to technological advances. For the past seven decades (1967 onwards), however, variation in yield is mainly due to weather with less impact from technological advances. Yet, the increased yield variability would not have occurred without higher yield potential from technological advances, so the two are interconnected as higher average yields are at risk of large yield losses under adverse conditions.
Yield Gap
Both non-irrigated and irrigated USDA survey data to variety trial data of relationships showed a significant yield gap that widened as yield increased above 40 bu/ac (Figure 4). For example, Thomas County, KS non-irrigated average winter wheat yields increased only by 0.33 bu/ac for every 1 bu/ac increase in variety trial data (Figure 4a).

That shows actual yield (in the field at the farm level) is about one-third of the potential yields occurring in controlled experimental studies in Thomas County. Further, Thomas County irrigated winter wheat yield increased only 0.43 bu/ac for every 1 bu/ac increase in Colby variety trial data (Figure 4b). Overall, actual wheat yield was 15–55% less than potential yield obtained from wheat variety trials, based on the relationship between university yield trials and county average farm-level yield data from the USDA.
Yield and In-Season Weather
Overall, non-irrigated winter wheat yields were positively correlated with precipitation in most months except for the winter periods of January, February, and the harvest month of June, and negatively correlated with high temperatures in months that coincide with flowering and maturity (Table 1). Furthermore, an increasing trend in temperature was detected in March and September for the variety trial sites over the years of this study.
Table 1. Correlation between non-irrigated and irrigated wheat yield with growing season precipitation and temperature from 1955 through 2022 across locations. In bold are significant correlations at P < 0.05 level.
Sept | Oct | Nov | Dec | Jan | Feb | March | April | May | June | |
|---|---|---|---|---|---|---|---|---|---|---|
Non-irrigated | ||||||||||
Growing season precipitation | ||||||||||
| r | 0.00 | 0.36 | 0.17 | 0.29 | 0.08 | 0.13 | 0.14 | 0.22 | 0.13 | –0.16 |
| p | 0.941 | <0.0001 | 0.0113 | <0.0001 | 0.2259 | 0.0597 | 0.0325 | 0.0009 | 0.0459 | 0.019 |
Growing season temperature | ||||||||||
| r | 0.13 | –0.08 | 0.06 | 0.07 | 0.11 | 0.01 | 0.05 | –0.19 | –0.23 | –0.05 |
| p | 0.0521 | 0.215 | 0.4015 | 0.3256 | 0.1068 | 0.9064 | 0.4235 | 0.0051 | 0.0004 | 0.482 |
These results similarly showed that fall precipitation, which promotes stand establishment and tillering, is critical for determining winter wheat yield potential and occurs very early in the production cycle (Holman et al., 2011).
Conclusion
Results presented above indicated a continuous increase in winter wheat yield over the period of this study, but annual winter wheat yield variations have also increased over time, i.e., winter wheat yield is less stable year-to-year than decades ago in Kansas. This is in part due to higher yield potential (with greater opportunity for relative yield losses from higher average yields) and weather. There was a strong positive correlation between non-irrigated winter wheat with monthly precipitation, except for the winter months of January, February, and the harvest month of June, and a negative correlation with high temperature in months that coincide with flowering and maturity. Fall precipitation was most critical for determining wheat yield potential. Both the variation and change in yield in recent years was mostly due to weather and management rather than technological advances. The yield gap between research and farm survey data demonstrates that there is a potential to increase actual winter wheat yield that is not attained due to either lack of technology awareness, management, or due to economic barriers for producers. The university yield trials are more likely to be planted on optimum planting dates, with abundant–fully adequate fertilizer and weed control implemented, since maximum financial net return is not the primary enterprise objective. Producers typically must cover larger amounts of acres, resulting in a much longer planting window and less timely field operations, and provide economic optimum fertilizer and weed control (or what they can afford), which likely results in producers having lower yield potential than university studies. Research and Extension education can help narrow the yield gap and increase producer profitability.
Self-Study CEU Quiz
Earn 0.5 CEUs in Crop Management by taking the quiz for the article at https://web.sciencesocieties.org/Learning-Center/Courses. For your convenience, the quiz is printed below. The CEU can be purchased individually, or you can access as part of your Online Classroom Subscription.
- Average winter wheat productivity in Kansas increased to ____ between the years _____.
- 22 bu/ac, 1950-1970
- 14 bu/ac, 1970-2022
- 37 bu/ac, 1860-1960
- 37 bu/ac, 1970-2022
- Year-to-year variation in wheat yield has been quite stable in recent years.
- True.
- False.
- Between 1850 and the present, the large increases in yield are mainly due to:
- The warmer weather.
- Technological advancements.
- The cooler weather.
- Large increases were not observed during that time.
- What weather factor was most critical for determining wheat yield potential?
- Fall precipitation.
- Fall temperature.
- Precipitation during May.
- Precipitation during January.
- Fall precipitation helps promote tillering.
- True.
- False.
Text © . The authors. CC BY-NC-ND 4.0. Except where otherwise noted, images are subject to copyright. Any reuse without express permission from the copyright owner is prohibited.


![Polyhalite is a naturally occurring evaporite mineral composed of potassium (K), calcium (Ca), magnesium (Mg), and sulfur (S) in sulfate form [K₂Ca₂Mg(SO₄)₄·2H₂O].](/files/styles/4_3_md/public/images/publications/crops-and-soils/2026/april/polyhalite-lead-1200.jpg.webp?itok=NNIDUkoz)

