Leveraging Machine Learning to Improve Soil Greenhouse Gas Predictions

You might be familiar with the adage, “All models are wrong, but some are useful.” No matter how complex and fine‐tuned, the models we use and rely on in science are approximations that sometimes fail to capture the intricacies and vagaries of the natural world.
This is especially true of phenomena like soil nitrous oxide (N2O) emissions. A potent greenhouse gas, N2O is produced by microbes in soil and can be forecast by familiar biogeochemical process‐based models like DayCent (https://www.nrel.colostate.edu/projects/century/), EPIC (“Environmental Policy Integrated Climate”; https://epicapex.tamu.edu/epic/), and DNDC (“DeNitrification‐DeComposition”; https://www.dndc.sr.unh.edu/).
But while N2O’s growing abundance in the atmosphere is chiefly tied to agriculture, it’s hard to predict how emissions will respond to changed management with these simulations. For example, in a 2021 paper based on research conducted at Michigan State University, soil biogeochemist and ASA and SSSA member Debasish Saha found that only around 20% of the variability in past N2O emissions cropping studies he reviewed could be explained by the commonly used process‐based cropping system models. “That’s low given the large impact of N2O on greenhouse gas budgets and indicates large uncertainty of the simulation models,” says Saha, now an assistant professor at the University of Tennessee, Knoxville.
Now, researchers are turning to machine learning (ML) to shore up these predictions and improve our fundamental understanding of soil N2O dynamics. In a new study (https://doi.org/10.1002/agj2.21185), published as part of the recent Agronomy Journal special section “Machine Learning in Agriculture,” researchers applied ML algorithms to predict emissions from a rye cover crop. And a new project, recently funded by the USDA and led by Saha, will use global data and ML to improve N2O flux prediction methods.
“If your model is accurate enough, then you can adapt or adjust your management practices and maybe be able to mitigate some of the large emissions,” says Saha, who was not involved with the Agronomy Journal paper. “We can avoid some of the large peaks that are mostly due to anthropogenic activities.”
Uncovering Emissions
It’s hard to turn the pages of CSA News magazine without encountering an article about cover crops. Over the last 40 years (https://acsess.onlinelibrary.wiley.com/doi/10.1002/csan.21072), research into their impacts and benefits has surged. Studies show that cover crops can help with carbon sequestration, improve soil fertility, bolster against erosion, and even protect water quality.
But while cover cropping is often touted as climate‐smart agriculture, there’s no blanket evidence dictating that the practice decreases emissions, says Deepak Joshi, first author on the Agronomy Journal paper and a Society member. “There have been a lot of studies done on soil health and cover crops. But … there was not clear evidence about whether cover crops are a sink or source of greenhouse gas emissions,” Joshi says.
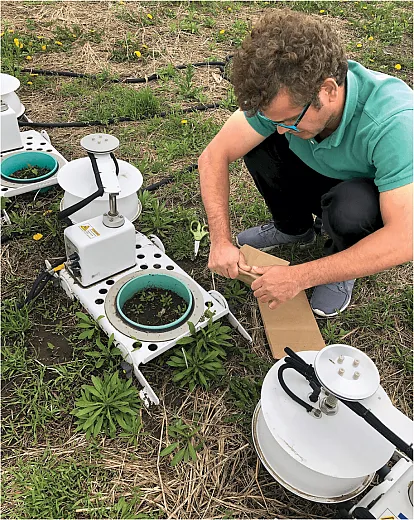
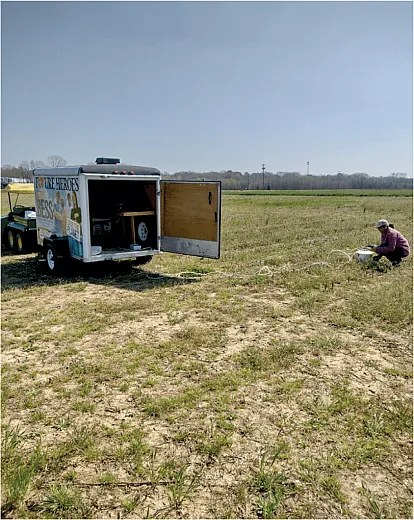
One reason for this obscurity is the elusive task of continuously measuring emissions. In their Agronomy Journal publication, Joshi and his colleagues used an automated chamber system to gather soil gas emissions six times a day for six months.
“Also, most other studies don’t separate before termination and after termination,” says Joshi, who completed the study while at South Dakota State University and is now an assistant professor of precision ag and remote sensing at Arkansas State University. Once cover crops are terminated and begin to decompose, they release inorganic nitrogen and organic substrates. This may increase emissions. To understand the full picture of cover crops’ contribution to a system’s greenhouse gas output, studying emissions across the entire season is critical, Joshi explains.
“When we talk about greenhouse gas emissions, we usually talk about carbon dioxide emissions,” Joshi says. But N2O, the same stuff in dental laughing gas, is particularly potent, he explains. With a global warming potential of 273, 1 ton of N2O absorbs 273 times more energy than 1 ton of CO2 in the atmosphere. Agricultural emissions and emissions from natural soils combined comprise 56–70% of all the world’s N2O sources. And while it’s relatively rarer in the atmosphere than the well‐known CO2, atmospheric N2O is increasing at a rate 44% higher than it was two decades ago.
Microbes and Models
In soils, N2O is produced mainly by microbes during nitrification as the by‐product of the incomplete conversion of nitrate to harmless N2 gas. Each step of this process is carried out via different enzymes encoded by certain microbial genes; many microbes can both produce and consume N2O. Their output—innocuous N2 or troublesome N2O—depends on a delicate dance of substrate and environmental variables. Management actions, like tillage and the application of fertilizer, and environmental conditions, like temperature and soil moisture, all have a major effect on soil N2O fluxes.
“The fluxes are very variable in space and in time,” Saha explains. Most of the time, emissions are low. “And then there are some peak moments—we call them ‘hot moments’: that’s when this flush of these greenhouse gases, mainly N2O, comes in. Those peak moments can expand from a few days to a few weeks. They have a huge contribution to the total flux, so it’s really important to understand why these ‘hot’ moments were created in the soil and what makes it ‘hotter.’”
Models like DayCent take inputs including air temperature, precipitation, surface soil texture, and land use and management information to simulate soil–plant–atmospheric cycling of water, nitrogen, and carbon. But the challenges compound because it was only in 2012 that researchers found there was a certain group of microbes that could only consume N2O and could not produce it. Aside from being of “tremendous climate interest,” this discovery illustrates a risk with process‐based models: you might be missing some piece of the big, messy puzzle, Saha says. “Our fundamental understanding of soil N2O cycling is evolving. That has a direct connection with the mathematical models and their limitation in accurately predicting N2O dynamics.”
A type of artificial intelligence, ML involves training statistical algorithms to recognize patterns in data and make predictions as a result. In contrast to a process‐based model, an ML algorithm learns to make predictions regardless of how well we humans understand the underlying biological process, Saha says. You are just feeding the data to an algorithm and telling it: “Go figure it out.” Thus far, this application of ML has not been possible mainly due to lack of data availability. That’s changing with technological revolutions in sensing and automated data collection and with the research community moving towards open‐source research and data sharing, Saha says.
Seeing the Forest for the Trees
That’s just what Joshi and his colleagues did with data from their study of cover crops in South Dakota. For two years, the team planted winter cereal rye (Secale cereale) in October and corn (Zea mays) the following spring, terminating the rye in June and harvesting the corn in the fall. Throughout, they measured greenhouse gas emissions from soil using the automatic chamber system and collected other data, including soil carbon and nitrogen content, soil microbial composition, soil and air temperature, and rainfall.
They found that while growing, the cover crop reduced N2O emissions. After termination, as the rye decomposed, microbial activity swelled and emissions increased. But when they combined both growing phases into a single analysis, they found no significant difference in N2O emission from the cover crop compared with the no‐cover crop treatment. “We found clear evidence that when do[ing] greenhouse emission studies in cover crops, we need to split the two different growth states separately,” Joshi explains. “We need to study those phases separately before termination and after termination.”
Those results will no doubt be helpful in guiding future cover crop studies. But Joshi decided to take a step further and use the experiments to test five different ML models’ abilities to predict greenhouse gas emissions. If the researchers input the environmental data they collected—the air temperature, soil temperature, soil moisture, rainfall, and more—from a particular time point, could an ML model accurately predict what the emissions at that time point had been?
The team used 75% of their dataset to train the ML models. They then fed the other 25% of their data to the models to test their predictive abilities. One, the random forest model, outshone the rest. This method splits the data into a forest’s worth of decision trees based on variables the model determined are important, cascading down this set of branched questions and answers to output a prediction based on what it’s “learned” from past data. The random forest model correctly predicted N2O emissions 73% of the time and CO2 emissions 85% of the time. By comparison, “with a traditional model, we were able to predict almost by 30%,” Joshi says.
Going Global
Saha has found similar results in his own work. In his 2021 paper published in Environmental Research Letters (https://dx.doi.org/10.1088/1748‐9326/abd2f3), he applied random forest models to six years’ worth of automated‐chamber N2O data from corn‐growing sites in Michigan and Wisconsin and found they could explain 65–89% of daily emission fluxes. Saha also applied the models to data from a totally different cropping system that the model was not trained on, a corn–soybean–wheat rotation. In this case, the model could only explain 38% of the site’s N2O flux variability.

This lack of generalizability is the next hurdle to clear for scientists interested in building strong ML models for N2O emissions predictions, Saha says, and limits how applicable the results from the Agronomy Journal study can be. Joshi concurs: “We need to test this in different climactic zones … so that we can say, OK, this model can be used everywhere,” he says.
“There is a need for integration of studies like this and datasets like this,” Saha adds. “Can you take this model and predict N2O emissions from cotton in Tennessee? No, probably not. If I have some data from Tennessee, some from California, some from Iowa, that will probably be more helpful for the model to improve the generalizability because we are talking about different soils, different climates, different management practices.”
He’s hoping to tackle this problem head‐on with his new project, a partnership with Michigan State and Penn State University, that will involve gathering available N2O flux data from collaborating labs around the globe that also use the automated chamber system. The team will use those measurements, from diverse soils, cropping systems, and environments in Australia, Denmark, Spain, and beyond, to train and develop powerful ML models for emissions predictions.
They’ll also combine ML and traditional models to see how process‐based models can be improved by what the ML models “learn” about relationship between the variables. “We will try to actually improve or modify the functional relationship that is already in the process models based on the learning by the ML model on the global dataset,” Saha explains. Joshi is also exploring this in his own work. The goal is, “can we combine both models together to have a better prediction accuracy?” he says.
And finally, Saha’s effort will also culminate in a publicly available database of these high‐resolution measurements so that researchers far and wide can test and enhance N2O prediction methods. “Not everyone has the luxury to have these kinds of data,” he says. And “the more data you have, and the more data from diverse conditions, the model will learn better.”
DIG DEEPER
The research featured in this article is from an upcoming special section in Agronomy Journal on “Machine‐Learning in Agriculture.” Some papers from the special section can be viewed online now within the Early View section of the journal: https://acsess.onlinelibrary.wiley.com/toc/14350645/0/0. The journal article specifically highlighted here is:
Joshi, D. R., Clay, D. E., Clay, S. A., Moriles‐Miller, J., Daigh, A. L. M., Reicks, G., & Westhoff, S. (2022). Quantification and machine learning based N2O–N and CO2–C emissions predictions from a decomposing rye cover crop. Agronomy Journal. https://doi.org/10.1002/agj2.21185
Text © . The authors. CC BY-NC-ND 4.0. Except where otherwise noted, images are subject to copyright. Any reuse without express permission from the copyright owner is prohibited.


