
Improving Estimates for Barley Residue Biomass, Nutrients, and Economic Value

Global market demands for barley are less than cereals such as corn, rice, and wheat, but barley plays a particularly important role in cropping systems in areas of high elevation and/ or latitude with short growing seasons. Estimation of residue nutrient uptake requires both a knowledge of the biomass produced, as well as the concentration of individual nutrients. These factors were evaluated in 2018 and 2019 from trials of four barley classes at five locations in southern Idaho. Earn 0.5 CEUs in Crop Management by reading the article and taking the quiz at https://web.sciencesocieties.org/Learning-Center/Courses.
Global market demands for barley are less than cereals such as corn, rice, and wheat, but barley plays a particularly important role in cropping systems in areas of high elevation and/or latitude with short growing seasons. Barley is largely associated with its role as the major cereal grain used for malting and brewing purposes, though barley use as human food and animal feed date into antiquity. In the United States, barley cultivar development has largely focused on genetics that meet the criteria needed for the malting and brewing industry (e.g., low grain protein/nitrogen) and to a lesser extent those used for animal feed. Genetic lines specifically developed for use as human food have found increased interest in the past decades due to the release of several high β-glucan cultivars, a particularly beneficial form of fiber. These high-fiber cultivars contribute to a heart-healthy diet by reducing the risks of cardiovascular disease and diabetes. In the cooler climate malt growing regions of the western U.S., viable winter malt barley cultivars were developed and released over the past two decades. While not as winter hardy as winter wheat, these cultivars represent an important addition to crop rotations in regions where winter barley is viable. Winter malt barley cultivars are of particular interest, as they have been shown to have exceptional yield in these areas. Additionally, winter cereals can effectively utilize winter precipitation stored in the soil through the early spring and mature earlier than spring cereals, which results in a reduced irrigation demand.
Grain is the major end-product of barley production; however, there is widespread use of the remaining residues (primarily straw) in the semi-arid western U.S. for animal feed, bedding, in mushroom production, and for other end-uses. Selling residue directly contributes to farm income and is often streamlined for the grower; many custom harvesters provide a full-service that includes cutting, baling, and removing the straw, adding little to no work to farm operations. While this short- term economic gain may be advantageous, there is also great value in leaving residue in the field. One benefit that is often overlooked is the value of residue to resupply soil nutrients over the long term. Even when residual nutrients are considered, they rarely are considered beyond N, P, and K.
Estimation of residue nutrient uptake requires both a knowledge of the biomass produced as well as the concentration of individual nutrients. Direct measurements of these two factors may or may not be known by producers, and thus a means of estimation must be used. This article will summarize recent published data from southeastern Idaho addressing this topic (Rogers et al., 2024). Studies were conducted across 10 site-years for spring malt, spring feed, spring food, and winter malt barley classes. Three cultivars of each class were sampled to develop a robust estimate across a wide range of genetics and environmental locations. Eight of the 10 site-years were irrigated and two were dryland. The irrigated sites
have particularly high yield potential, due to the optimal regional growing conditions and availability of high-quality irrigation water. Samples for this study were collected from the soil surface and include both the straw and chaff and do not attempt to adjust based on the recovery efficiency from baling operations.
Harvest Indices
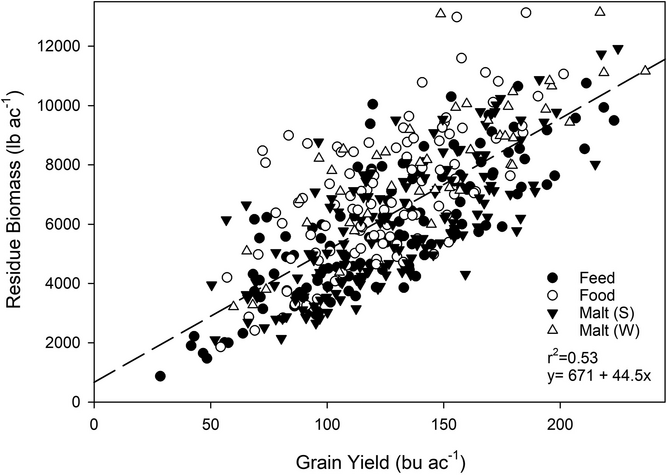
Residue biomass can be estimated based on measured relationships between residue and grain yield, since they are linearly correlated. This is advantageous as grain yield is normally measured by producers and, at larger scales, reported annually on a crop year basis by services such as the USDA National Agricultural Statistics Service (US- DA-NASS, 2023). Our regression estimates for the relationships between residue biomass and grain yield had r2 that ranged from 0.43 to 0.62. These estimates indicate that grain yield is a key factor for determining biomass. Figure 1 illustrates this relationship, showing the average relationship of residue biomass to grain yield across all classes of barley, which resulted in an r2 = 0.53. In crop production literature, this relationship is usually explained based on the harvest index (HI), and this will be the estimation method discussed going forward. We also note that at times these relationships have been reported as the ratio of residue to grain (R/G) for use in the USDA's Revised Universal Soil Loss equation (Renard, 1997) and that conversions can be made between the two methods and are discussed in more detail in our published manuscript (Rogers et al., 2024).
Harvest index (HI) = (Grain yield ∕ (Grain yield + Residue biomass))
Residue biomass = ((1 − HI) ∕ HI) × Grain yield
Across study locations, measured HI values averaged 0.51, 0.47, 0.52, and 0.46 for feed, food, spring malt, and winter malt barley, respectively. These are similar to but vary somewhat from the average HI of 0.50 used by Tarkalson et al. (2009) to estimate biomass and nutrient uptake in barley residue in the same growing region. Spring food and winter malt diverged the most from previous estimates and little to no publications have reported data for these classes of barley. Thus, this additional HI data can be incorporated into the equations above to estimate residue biomass from known grain yield of specific barley classes.
Nutrient Uptake
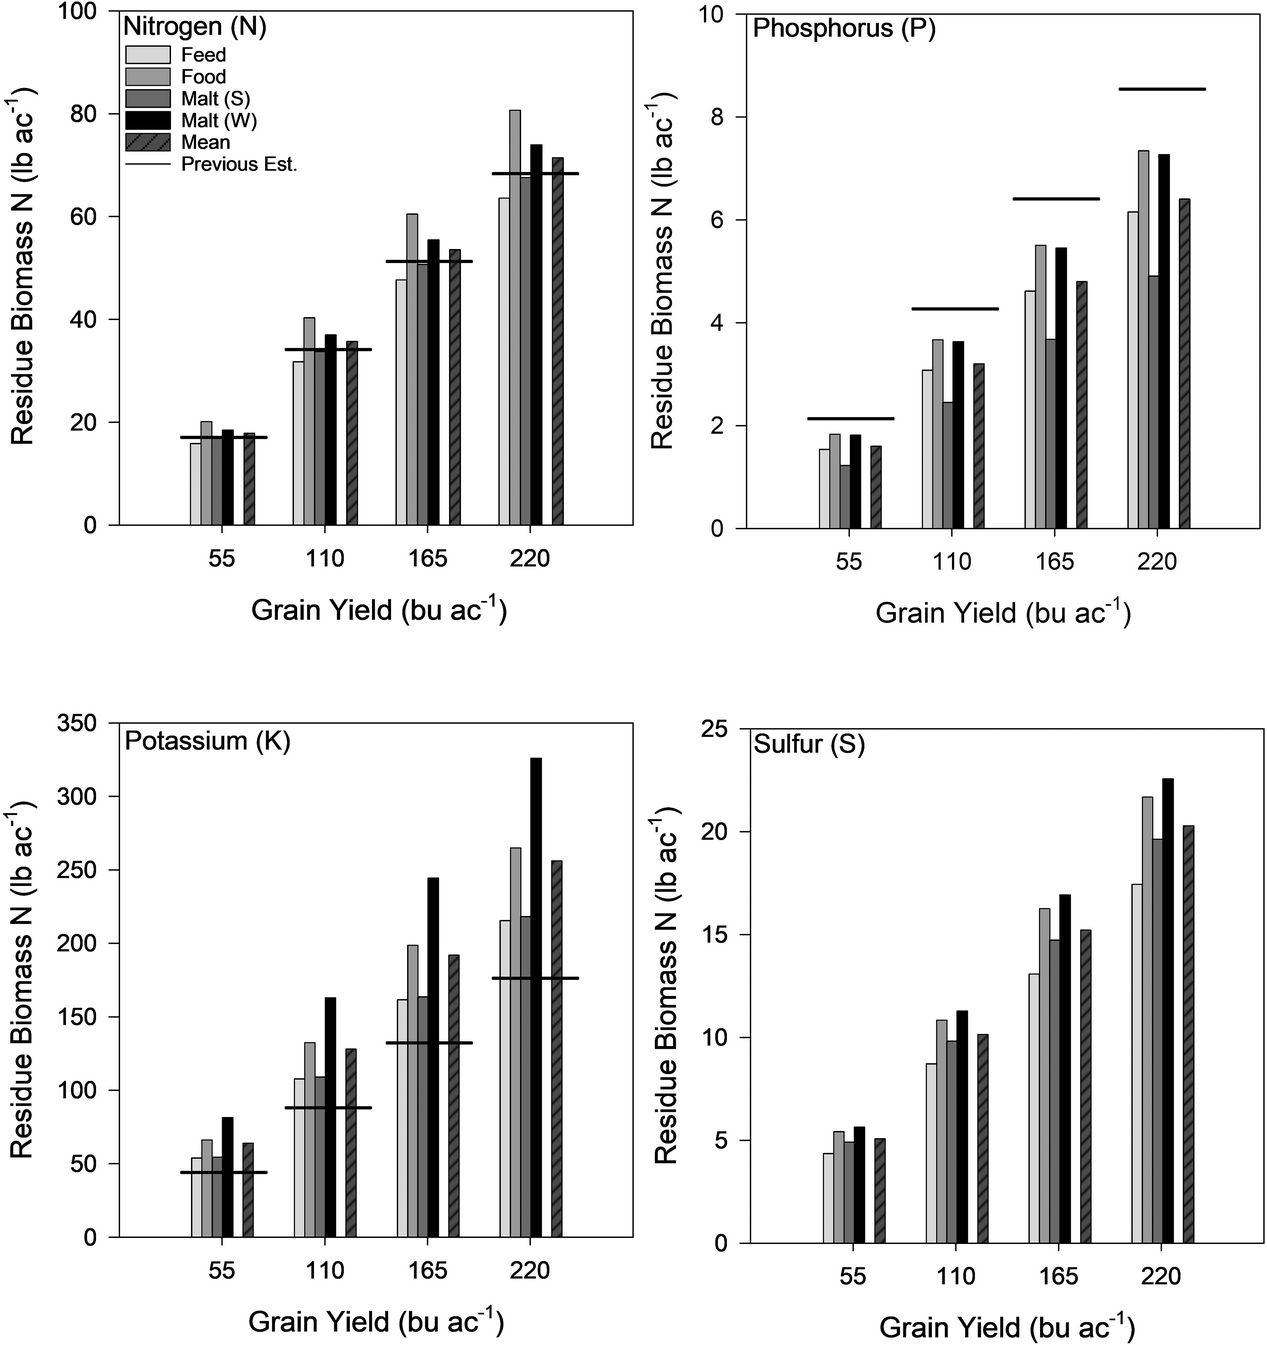
Measured nutrient concentration median values are shown in Table 1. The published manuscript provides more detailed information and summary statistics indicating the variability of these measures. Across barley classes, nutrient concentrations had some variability, with P concentrations of spring malt residue nearly 25% less than any of the other classes. Potassium is also on the high end of previously reported values. The C:N ratios of residues were also calculated, averaging 67:1. Residue biomass was then multiplied by nutrient concentration to determine nutrient uptake. Tarkalson et al. (2009) reported estimates of N, P, K uptake for barley residue and our data is compared to theirs in Figure 2. Average N uptake of the residue was the most similar between the two studies, with spring malt N being nearly identical, feed N estimates slightly lower, and food and winter malt residue N greater. Phosphorus uptake in the current study was less than and K uptake greater than previous estimates from Tarkalson et al. (2009). Differences are likely due to the fact that the current study focused largely on high-input irrigated production and included spring food and winter malt cultivars that were not included in the previous work. At a larger scale, and when a range of classes are grown, a weighting approach should be considered to refine estimates to account for variation among barley classes.
Nutrient | Unit | Spring | Spring | Spring | Winter | Combined |
|---|---|---|---|---|---|---|
C | g/kg | 419 | 416 | 418 | 414 | 417 |
N | g/kg | 6.2 | 6.7 | 6.2 | 5.9 | 6.2 |
C:N | ratio | 68:1 | 62:1 | 67:1 | 70:1 | 67:1 |
P | g/kg | 0.60 | 0.61 | 0.45 | 0.58 | 0.55 |
K | g/kg | 21 | 22 | 20 | 26 | 21 |
Ca | g/kg | 5.8 | 5.4 | 5.8 | 5.3 | 5.6 |
Mg | g/kg | 1.0 | 1.1 | 1.1 | 1.0 | 1.1 |
S | g/kg | 1.7 | 1.8 | 1.8 | 1.8 | 1.8 |
Fe | mg/kg | - | - | - | - | - |
Zn | mg/kg | 10 | 16 | 17 | 13 | 15 |
Mn | mg/kg | 28 | 27 | 27 | 21 | 26 |
Cu | mg/kg | - | - | - | - | - |
As above, P and K were particularly notable, with current estimates falling well below and above previous estimates, respectively. This finding is important for estimation of net P export from residue harvesting used for modelling P-cycling in the agroecosystem. Also, of note are the high K concentrations in the residue that are likely due to luxury consumption from the high soil K concentrations in the region. Soil K test values measured upward of 400 mg kg-1 in the 1960s, (Tindall & Westermann, 1994) but have decreased to an average of 251 mg kg-1 in a recent study across the region (Rogers, Dari, & Schroeder, 2019).While current soil K levels are considered largely sufficient for crop growth, it is important to consider the removal of K from a long-term perspective. This is particularly important for cropping systems of high biomass exporting crops (alfalfa, silage corn, cereal grain with straw removal, etc.) that support the 3rd largest dairy producing state in the U.S.
Fertilizer Replacement Costs
Cost estimates of nutrients in barley residue can be determined using fertilizer prices and predicted residue biomass nutrient uptake based on class-specific HI. Our research used Idaho Enterprise Budget estimates from 2001 to 2019 to determine low, average, and high fertilizer prices over the past two-decades (Table 2) and class-specific HI.
Table 2. Fertilizer cost estimates for N, P, K, and S based on historical prices from University of Idaho Enterprise Budgets for 2001 – 2019.
| Nutrient prices | ||
|---|---|---|---|
Nutrient | Low price | Average price | High price |
N | 0.29 | 0.44 | 0.64 |
P | 0.08 | 0.16 | 0.24 |
K | 0.12 | 0.28 | 0.55 |
S | 0.11 | 0.18 | 0.24 |
For comparison, we have scaled Tarkalson et al. (2009) data using their estimated uptakes at a given grain yield and fertilizer prices from the Idaho Enterprise Budgets. Tarkalson et al. (2009) did not include S in their residue uptake of cost estimates, but we have retained in ours as its value was minor compared to other nutrients. Average nutrient replacement values ranged from 28 to 111 $/ac within the range of estimated residue biomasses, which was greater than previous estimates (Table 3). Furthermore, the average barley yield for the state of Idaho is 112 bu/ac averaged across dryland and irrigated production. The region of the study is predominantly irrigated, where yields would largely fall at or above the 110 bu/ac cost estimate which ranged from 28 to 100 $/ac based on the range of fertilizer price estimates.
Table 3. Estimates of fertilizer replacement cost for N, P, K, and S accumulated in barley residue biomass based on the average of class-specific harvest index (HI) and average nutrient concentrations for studies conducted in 2018 and 2019 in southern Idaho. Tarkalson et al. (2009) was scaled based on their reported uptake estimates for N, P, K and fertilizer cost estimates from Table 2.
| Total N, P, K, and S ($/ac) | |||
|---|---|---|---|---|
Grain yield (bu/ac) | Low | Mean | High | Tarkalson |
55 | 14 | 28 | 50 | 21 |
110 | 28 | 55 | 100 | 41 |
165 | 42 | 83 | 150 | 62 |
220 | 56 | 111 | 201 | 83 |
Summary
Barley is widely produced in the semi-arid western U.S. Production is largely focused on harvested grain for feed and malt. Recent market opportunities and production practices have increased interest in spring food barley and winter malt production. As grain is the primary end product, less research has been conducted on residue. Data from the current study provides class-specific HI estimates, expanded nutrient concentration and uptake data, and updated fertilizer replacement value estimates
for barley residue. While site-specific measurements are always optimal, our approach permits estimations based on measured grain yield to determine residue biomass, nutrient concentrations, nutrient uptake, and fertilizer replacement value. This approach allows the inclusion of measured data (residue biomass, nutrient concentration, and fertilizer costs) in the calculations which would improve the estimate of a given field. Nutrients in crop residues have an inherent value in nutrient cycling that should be weighed against the direct monetary gain from sales. While beyond the scope of this study, other non-nutrient factors of the residue biomass should also be considered for developing resilient cropping systems, including erosion and runoff control, soil organic matter enrichment, and improved soil moisture retention. The economic analysis indicated that N and K were the largest drivers of residue fertilizer replacement costs and that total fertilizer replacement costs could range from 14 to 201 $/ac. Data and methods from this study improve our ability to estimate barley residue biomass, nutrient concentrations and uptake, and fertilizer replacement value for barley classes grown in the semi-arid western U.S.
References
Renard, K. G. (1997). Predicting soil erosion by water: A guide to conservation planning with the Revised Universal Soil Loss equation (RUSLE). USDA-ARS.
Rogers, C.W., Dari, B., & Schroeder, K. L. (2019). Comparison of soil test extractants for potassium, magnesium, sulfur, and micronutrients in Idaho soils. Agrosystems, Geosciences, & Environment, 2(1), 1–9. https://doi.org/10.2134/age2019.08.0067
Rogers, C.W., Adams, C.B., Marshall, J.M., Hatzenbuehler, P., Thurgood, G., Dari, B., Loomis, G., & Tarkalson, D. D. (2024). Barley residue biomass, nutrient content, and relationships with grain yield. Crop Science. https://doi.org/10.1002/csc2.21263
Tarkalson, D. D., Brown, B., Kok, H., & Bjorneberg, D. L. (2009). Irrigated small-grain residue management effects on soil chemical and physical properties and nutrient cycling. Soil Science, 174, 303–311. https://doi.org/10.1097/SS.0b013e3181a82a5f
Tindall, T., & Westermann, D. (1994). Potatoes and potassium for irrigated southern Idaho soils. Better Crops, 79(4), 8–11. USDA-NASS. (2023). Quick stats database. USDA-NASS. https://quickstats.nass.usda.gov/
Text © . The authors. CC BY-NC-ND 4.0. Except where otherwise noted, images are subject to copyright. Any reuse without express permission from the copyright owner is prohibited.