
Soil Fertility, Fertilizers, and Crop Nutrition: Past, Present, and Future
Part Two: The Development of the North American Fertilizer Industry

Over the past few decades, the North American fertilizer sector has experienced significant transformations, integrating into the global supply chain, which is pivotal for sustaining an abundant source of food, fiber, and energy. While the fundamental fertilizer products containing N, P, K, and S have remained largely unchanged, common fertilizers have evolved into agricultural commodities that are extensively traded on a global scale. Consequently, farmers often lack visibility into the origins of the fertilizers used for their crops. The role of the modern plant nutrient industry is essential for feeding a hungry world and preventing degradation of vital soil resources. There is growing awareness of the need for enhanced nutrient stewardship to meet local, regional, and global concerns. This is the second article in a three-part series on the past, present, and future of the North American fertilizer industry. Earn 1.5 CEUs in Nutrient Management by reading this article and taking the quiz at https://web.sciencesocieties.org/Learning-Center/Courses.
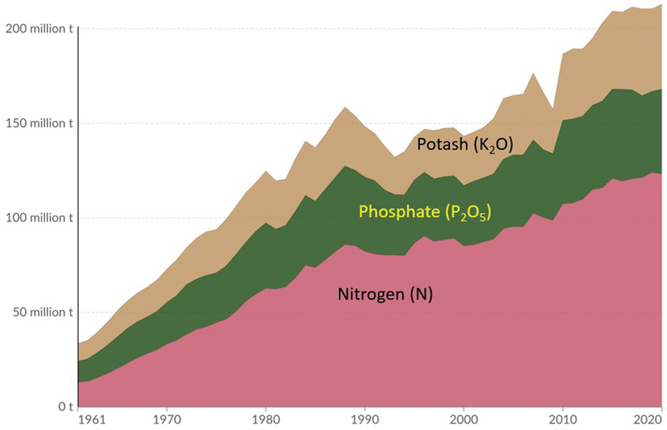
Following the second world war, immense human suffering and famine gripped many parts of the world because of natural disaster, political uncertainty, and food scarcity. The emergence of the Green Revolution in the 1960s led to the introduction of high-yielding grain crops, which increased food production at unprecedented rates. These new crop varieties responded remarkably well to improved crop nutrition, notably N fertilizer, catalyzing changes in the plant nutrition market and further expansion of fertilizer production. The latter part of the 20th century and first decades of the 21st century witnessed consolidation of many small and regional fertilizer producers into a shrinking number of multinational companies during the globalization of the industry. Nonetheless, overall production and consumption continues to increase (Figure 1).
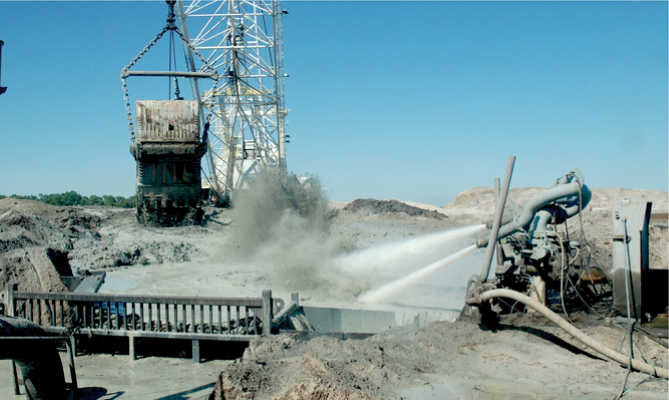
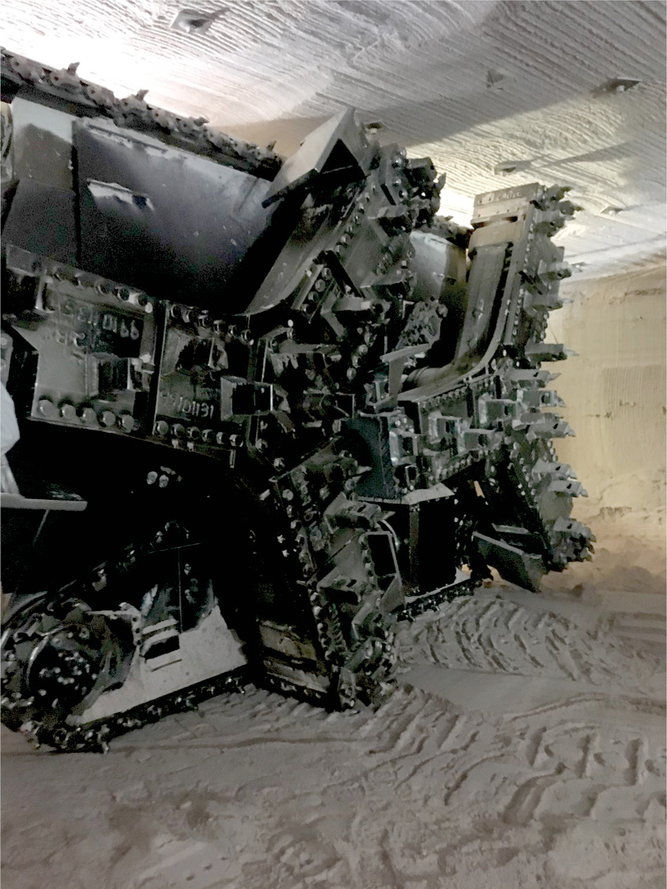
Fertilizer, a bulky and heavy commodity, requires considerable logistics to move large quantities of products from their origin to farmer fields. International fertilizer trade utilizes large ocean tankers moving products between key ports and terminals while domestic transportation occurs through a linked network of river barges, pipelines, railroad cars, and trucks. The reliance on petroleum products for both manufacturing and transportation is rapidly reflected in retail prices in response to changes in global energy costs. Adding to this complexity, the bulk of North American fertilizer application occurs within a short window of a few months in fall or spring. The logistics of producing and transporting fertilizer throughout the year, so it will be available for field application during peak demand requires considerable storage capacity and planning.
Nitrogen (N)
Between the 1970s and 2000, various factors converged to shape the North American N fertilizer industry, resulting in fewer manufacturing facilities and considerable consolidation. Until the 1970s, New Deal farm policies were largely focused on managing crop supplies and limiting overproduction, which capped the demand for fertilizer. Additionally, N fertilizer prices were relatively high because up to 70% of the cost of producing N fertilizers is associated with the price of natural gas, which was at record highs in North America during the 1970s and 1980s.
Lower N fertilizer demand and higher production costs resulted in a reduction from 59 to 22 ammonia production facilities in the U.S., accompanied by a reduction in the number of companies from 46 to 13 by 2000 (Bekkerman et al., 2020). In 1980, annual ammonia capacity in the U.S. exceeded 20 million metric tons; by 2012, that capacity had decreased to approximately 12 million metric tons.
This industry retrenchment reversed when several factors converged. High-yielding crop varieties gained widespread adoption, and the U.S. farm policy pivoted to encourage greater production. Modern cultivars responded to higher N application rates to meet their yield potential, and corn acreage expanded into new regions, driving demand for additional N fertilizer supply. National ethanol programs that encouraged additional corn production further boosted N fertilizer demand.
The surge in natural gas production resulting from hydraulic fracturing and new drilling methods was another pivotal factor in the resurgence of the North American N industry. This methane-recovery innovation greatly reduced the cost of synthesizing N fertilizer, currently positioning North America as one of the lowest-cost producers of natural gas and ammonia in the world.
Nitrogen fertilizer production was historically based in locations where natural gas supplies are abundant, close to transportation hubs, and near agricultural areas, but this is not always possible. Producing ammonia is a favored way to upgrade methane to a more valuable commodity. For this reason, ammonia has been produced in unexpected areas such as Trinidad and Alaska and then transported around the world. Ammonia may be further upgraded to urea, a more easily transported commodity and the most used N fertilizer globally.
Regional consolidation and industry expansion continues to occur as swings in the price of raw materials (natural gas) influence profitability. For example, N fertilizer manufacturers in parts of Europe recently faced production and profitability challenges resulting from high natural gas prices. Global N fertilizer prices are volatile and fluctuate widely in response to rapid changes in crop prices, transport logistics, energy costs, and global events.
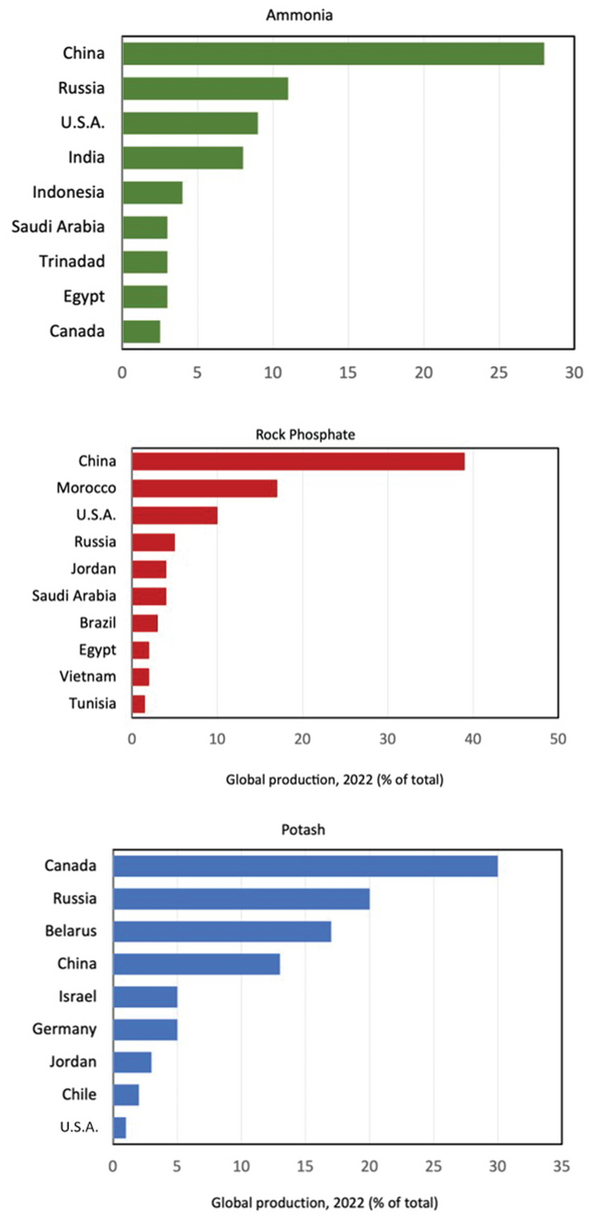
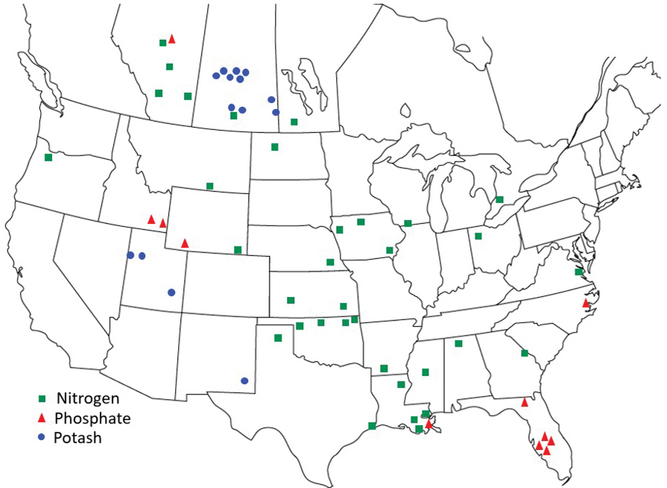
Nitrogen fertilizer production spans the globe with China being both the world’s largest producer and consumer (Figure 2). In North America, ammonia is produced in many locations, but it is primarily centered in regions where natural gas is affordable and the finished N fertilizer is easily transported. Ammonia is sometimes used for direct application in the field, but most of it is converted into other N fertilizers, such as urea, urea ammonium nitrate, nitrate, or ammoniated phosphates. Notably, the NuStar ammonia pipeline transports more than 1.5 million tons/yr of anhydrous ammonia across a 2,000-mi network originating near the Gulf of Mexico (Louisiana) and ending in Indiana, Iowa, and Nebraska. Anhydrous ammonia is naturally a gas, but under moderate pressure or with refrigeration, it easily changes to a liquid. This characteristic allows liquified ammonia to be transported in pipelines, pressurized railway cars, tank trucks, and cylinders. Ammonia is stored in large terminals that are cooled to –28 °F to maintain its liquid state without pressure. The U.S. has more than 10,000 ammonia storage sites with many of them connected to the pipeline.
Since North American producers sell their N fertilizers on the international market and international companies import fertilizer products to the U.S., changes in global conditions quickly impact domestic prices. Domestic markets are greatly influenced by global supply and demand and sociopolitical events. Farmers buy nutrients from around the world at their local retailer without knowing the product origin. This may change in the future with growing emphasis on input traceability and the appeal of using fertilizer sources with a low-carbon footprint. A concise description of each of the common fertilizer products is found here: http://www.ipni.net/specifics.
Phosphate
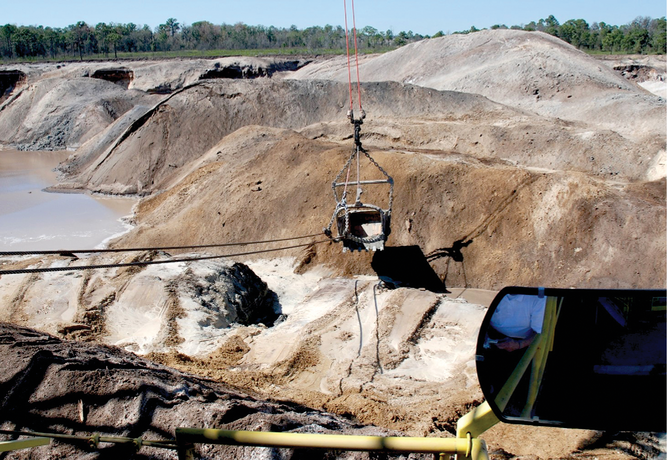
The North American phosphate industry, dominated now by a few companies, expanded beyond Florida in the 1960s when eastern North Carolina’s marine rock P deposit came into production. Other mining operations closed, such as in Tennessee and Central Alberta. Smaller-scale P mining still occurs in the Western U.S. Phosphoria Field, which covers Idaho, Utah, Montana, and Wyoming. This Western deposit was developed in the early 1900s, and at one time, the region had 70 active P mines, predominantly underground. Presently, mining of this deposit only occurs in Idaho, Utah, and Wyoming using surface techniques (Jasinski et al., 2006).
The production of fertilizer P from recycled animal and municipal wastewater and new rock P production near Chicoutimi, Quebec may add to the North American P supply. Florida remains the primary source of domestic P fertilizer, followed by North Carolina.
Phosphate rock is currently mined in many parts of the world and new geologic deposits are under development. The leading global producer of P fertilizer is China, followed by Morocco, USA, Russia, and Saudi Arabia. Global P trade consists of unprocessed phosphate rock, phosphoric acid, and finished P fertilizers. In North America, the most common P fertilizers are diammonium and monoammonium phosphates, ammonium polyphosphate, and triple superphosphate. Their pricing is largely determined by the raw material cost of phosphate rock, sulfuric acid, and ammonia. Phosphorus fertilizer imports from offshore sources have fluctuated but continue to grow.
Potash
Potash production in North America took a huge leap forward with the discovery of vast underground deposits of sylvinite and sylvite minerals in Saskatchewan that occurred during oil exploration. Commercial potash production began in this region in the 1960s, and within the following decade, 12 companies had opened 10 underground mines at depths reaching 2,900 to 3,600 ft. In addition to underground shaft mining, potash extraction also occurs using brine solution mines in both U.S. and Canadian deposits. This technique involves pumping water deep underground to dissolve the soluble potash salts. The saturated K-rich brine solutions are pumped back to the surface, and the water is evaporated, leaving behind the solid K fertilizer salt. Solar evaporation of naturally occurring K-rich surface brines also occurs in places such as the Great Salt Lake (Utah) and the Dead Sea (Israel and Jordan).
Potassium chloride is by far the most common K fertilizer due to its geologic abundance. Other important geologic deposits produce langbeinite (potassium magnesium sulfate K2SO4.2MgSO4) in New Mexico, potassium sulfate (K2SO4 from the Great Salt Lake), and polyhalite [K2Ca2Mg(SO4)4·2H2O from the UK]. Smaller quantities of specialty K fertilizer are also used for specific soil and crop nutrition purposes.
The global K fertilizer market is currently dominated by the Canadian potash export association (Canpotex) and the Russian/Belarus mining companies. New potash resources are under development in every continent, and additional production is expected to expand the global supply, including new potash mines in western Canada, that should bring additional K fertilizer to the North American market within a few years.
New Technology Since TVA Innovations
It is estimated that around 75% of commonly used fertilizers and fertilizer technology were developed or improved between the 1950s and 1990 at the Tennessee Valley Authority (TVA) in Muscle Shoals, AL. This federal research center closed in the early 1990s, but important development work continues at the adjacent International Fertilizer Development Center (IFDC). Though IFDC continues to support development of fertilizer technologies, the majority of fertilizer development work is now largely done by industry and industry-sponsored researchers.chnologies.
Incentives for promoting farmer profitability and sustainability have led to many developments in specialty fertilizer products, coatings and additives, digital tools for better recommendations, and improved nutrient monitoring and recording on the farm. Narrow grower profit margins and awareness of environmental impacts of nutrients lost from the field continue to encourage better nutrient management practices that result in increased nutrient use efficiency. Box 1 lists some of the commonly used technologies.
Expanded Use of Animal Manure as a Nutrient Source
Growing North American animal and livestock industries have led to an increased supply of recoverable manure. Using organic and manure-based nutrients to supplement or replace mineral fertilizers is sometimes called “integrated nutrient management.”
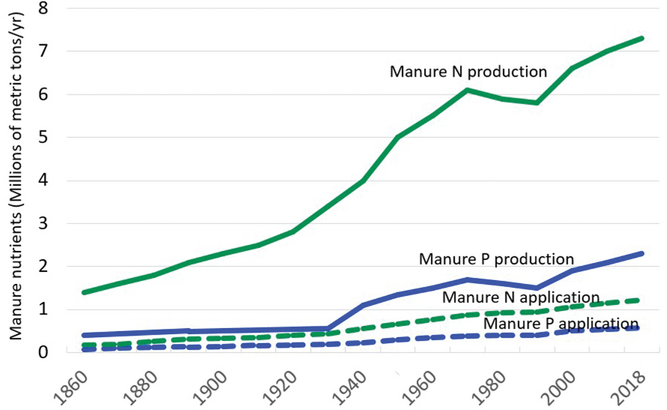
In the past 150 years, the amount of nutrients produced from U.S. animal manure has grown from 1.5 million tons N/yr to >7 millions tons of N while manure P production increased from 330,000 tons P/yr to 2.6 millions tons/yr (Figure 3; Bian et al., 2021). Despite the expansion of both crop land area and animal production, total manure N application to U.S. cropland in 2017 was merely 1.4 million tons of N and 661,000 tons of P. This amounts to only 18 and 25% of total N and P manure production, respectively, currently used on cropland (excluding grazed pasture) as a nutrient source.
This low use of manure-derived nutrients results from barriers such as (1) animal manure often being produced in regions that do not match crop and soil needs, (2) high costs of collection, treatment, and transport of manure, (3) inability to use uncollectable manure to fertilize crops in other fields, and (4) the mismatch of manure nutrient ratios with soil and crop requirements. The poor recovery of nutrient-rich manures is a significant waste of potentially valuable resources and can lead to environmental harm when the nutrients inadvertently enter waterways and the air.
Most farmers use manure from their animal operations on their own fields, but there are too few markets that can facilitate manure transport to the fields where nutrients and organic matter are most needed. Large, concentrated animal-feeding operations transport feed materials many miles from areas of feed production, bringing large volumes of nutrients from harvested grain and forage fields to the animals. The manure nutrients produced are often not returned to the fields from which the nutrients are harvested, creating a geographical nutrient distribution challenge. Recent surveys indicate that most manure applied to corn fields is not incorporated into the soil. While this practice fits well into the adoption of no-till practices, spreading manure on the soil surface enhances ammonia volatilization and increases the susceptibility of nutrient loss through water runoff.
The fertilizer and animal industries have worked together to develop organo-mineral products from organic resources that can be fortified with mineral nutrients. These blended products could ideally meet crop nutritional demands, facilitate return of valuable organic matter to the field, close the nutrient loop through recycling, and provide a convenient product that is affordable to farmers. Unfortunately, there have been too few successful ventures of widespread integration of inorganic and organic nutrient sources, and this goal remains mostly elusive.
Soil Nutrient Status: Building or Depleting?
Surveys conducted by the International Plant Nutrition Institute since 2001 (now continued by TFI) of North American soil-testing laboratories show a worrisome trend. Using summaries from millions of soil test results, the most recent survey (2020) confirms that a growing percentage of North American agricultural soils contain “below critical” concentrations of plant-available P and K (https://soiltest.tfi.org/). This downward trend in soil fertility over the past 20 years indicates that average removal of plant nutrients during crop harvest exceeds the nutrient inputs provided in fertilizer and manure. Although regional variability and local areas of excess manure production and application exist, the trend remains clear that many farm soils are becoming slowly depleted of their previous fertility following years of removing ever higher-yielding crops with inadequate replacement of harvested plant nutrients.
A major shift in fertilizer materials over the past 50 years has seen the reduction in the use of multi- nutrient compound NPK fertilizers (such as 15-15-15) and a shift to prescription blends of single- nutrient sources (such as a customized mixture of urea, DAP, and KCl). The flexibility of mixing individual fertilizer components at a local blending facility allows farmers to meet specific crop needs and the ability to uniquely respond to the results from soil testing. The past couple of decades has seen somewhat of a resurgence in some multi-nutrient fertilizers, such as sulfur-enhanced phosphate or nitrogen fertilizers or micronutrient additives to the primary nutrient sources.
Environmental Issues Emerging With Nutrient Use
Inadequate attention to fertilizer and manure management over the past 50 years has resulted in significant environmental concerns. As examples, water quality degradation in the Chesapeake Bay brought considerable scrutiny to farm watershed management and the need for integrated management plans to keep nutrients out of the water. The annual hypoxic zone in the Gulf of Mexico is partly linked to the nutrient load flowing from farmland along the Mississippi and Missouri Rivers. Groundwater nitrate concentrations in parts of the Central and Salinas Valleys of California exceed safe drinking-water standards. Similarly, excessive nitrate concentrations in Minnesota and Nebraska groundwater have resulted in voluntary and mandatory regulations of fertilizer and manure management practices.
Water pollution and eutrophication in Lake Erie and Lake Winnipeg have received attention as P is lost from surrounding agricultural fields from both fertilizer and animal manure. More recently, reducing nitrous oxide (N2O) emissions, a potent greenhouse gas, from N-fertilized fields has become a global priority. These few examples illustrate the complicated challenge facing farmers to improve nutrient stewardship while maintaining global food production and profitability.
4R Nutrient Stewardship Framework
To better communicate the science and practices associated with improved nutrient management, the International Plant Nutrition Institute (IPNI) and international partners developed the concept of 4R nutrient stewardship, which was launched in 2007 (Fixen, 2020). This approach involves making decisions of the right source of nutrients, right rate of application, right time of application, and the right placement of nutrients in consideration of economic, environmental, and social outcomes. In the past 15 years, the 4R decision framework has become widely adopted by the fertilizer industry, the farm community, and the public sector to integrate technical nutrient-planning in a comprehensive way. Materials for 4R training have been translated into many languages, and 4R stewardship practices are being adopted around the world. However, implementing 4R nutrient stewardship requires continual effort to define, implement, and measure what is the “right” set of practices in specific conditions. Greater awareness of improved nutrient stewardship needs to be engrained in every fertilizer decision throughout the agricultural industry.
The North American fertilizer industry has undergone many changes in the past decades to become fully enmeshed in a global supply chain that supports the production of a healthy and abundant supply of food, fiber, and energy. While the chemistry of many core N, P, K, and S fertilizer products has not changed much during this time, the common fertilizer products have become agricultural commodities that are widely traded and accessible to farmers around the world. Recent years have been characterized by two important changes to the industry: (1) consolidation of many smaller fertilizer producers into a shrinking number of multinational companies; and 2) globalization of the industry to meet world demands for critical nutrient inputs. These essential plant nutrients are vital to feeding a growing world and preventing nutrient depletion and degradation of our precious soil resources. The final upcoming article in this series explores some of the opportunities and challenges ahead for the North American fertilizer industry.
Self-Study CEU Quiz
Earn 1.5 CEUs in Nutrient Management by taking the quiz for the article at https://web.sciencesocieties.org/Learning-Center/Courses. For your convenience, the quiz is printed below. The CEU can be purchased individually, or you can access as part of your Online Classroom Subscription.
- The North American fertilizer industry in the latter half of the 20th century can be characterized by
- localized production and demand.
- consolidation of small, regional producers into large multinational companies.
- declining global importance.
- independence from other global markets.
- The world’s largest nitrogen fertilizer-consuming nation is
- Brazil.
- India.
- United States.
- China.
- The resurgence of U.S. nitrogen fertilizer production in recent decades is attributable to which of the following factors?
- Demand for corn for ethanol production.
- Demand for nitrogen for increasing yields and crop productivity.
- Globally competitive energy prices.
- All of the above.
- The decrease in U.S. nitrogen production capacity in the 1970s and 1980s resulted largely from
- disruptions in energy supply following the Vietnam war.
- decreased demand and high production costs.
- transportation restrictions.
- government restrictions on production.
- Ammonia is usually transported as a
- liquid.
- gas.
- solid.
- None of the above.
- Most U.S. phosphate fertilizer is produced in which state?
- Utah.
- Wyoming.
- North Carolina.
- Florida.
- Which of the following countries are major global phosphate producers?
- Saudi Arabia.
- China.
- Morocco.
- All of the above.
- Which of these phosphorus fertilizers would be considered the least widely used?
- Rock phosphate.
- Monoammonium phosphate.
- Diammonium phosphate.
- Ammonium polyphosphate.
- Most North American potassium fertilizer is produced by
- solution mining.
- underground shaft mining.
- brine evaporation.
- Haber-Bosch synthesis.
- Which of these countries is most dominant in global potash trade?
- China.
- Morocco.
- Canada.
- U.S.
- A variety of potassium minerals are mined to produce potassium fertilizer. Which of the following minerals would be the most likely source of most potassium fertilizer used in North America?
- Sylvinite.
- Langbeinite.
- Apatite.
- Polyhalite.
- Which organization is credited with developing most of the fertilizer production technology in use in North America today?
- TFI.
- IPNI.
- USDA.
- TVA.
- The concept of 4R nutrient stewardship has been adopted to manage nutrient applications with regard for which of these outcomes?
- Economic, social, and logistical.
- Economic, environmental, and social.
- Logistical, regulatory, and production.
- Social, environmental, and regulatory.
- The North American soil test inventory initiated by the International Plant Nutrition Institute (IPNI) and now continued by The Fertilizer Institute (TFI) indicates which of the following general trends?
- Increasing soil pH and micronutrient levels in most agricultural soils.
- Decreasing numbers of soils are being sampled.
- Increasing percentage of soils testing below critical level in plant-available P and K.
- Average nutrient inputs in fertilizer and manure greatly exceed crop removal.
- Underutilization of manure nutrients most likely results from
- potential soil quality degradation from manure application.
- poor nutrient availability in manure sources.
- high costs of manure collection and transport.
- regulatory limits on manure application rates.
Text © . The authors. CC BY-NC-ND 4.0. Except where otherwise noted, images are subject to copyright. Any reuse without express permission from the copyright owner is prohibited.