
Fertilizer industry innovations supporting climate mitigation

Fertilizers, particularly nitrogen, comprise a large part of the carbon footprint of crop production. The industry is exploring and applying innovations toward reducing emissions of greenhouse gases arising from the manufacture and use of fertilizers.
Carbon intensity is becoming a relevant factor in the markets for agricultural products. For example, ethanol producers may begin to ask for a carbon intensity score for the corn they purchase from American farmers as initiatives like the sustainable aviation fuel tax are implemented (Kiel, 2023). This trend is expected to grow, as markets will need to account for the large share of greenhouse gases (GHGs) emitted from the food system, both in domestic production and in international trade (Foong et al., 2022). Globally, food systems have been estimated to be responsible for 31% of greenhouse gas emissions arising from human activity (IFA, 2022).
While crop production comprises only part of food system emissions, fertilizers, particularly nitrogen (N), are a substantial contributor to the carbon footprint of crops. The fertilizer sector’s emissions are divided into three different emission scopes. Scope 1 is defined as the direct greenhouse emissions, such as the use of fossil fuels; Scope 2 includes emissions that are related to electricity use; and Scope 3 encompasses all other indirect GHG emissions, including the emissions related to fertilizer use in the field (IFA, 2022). The production and use of fertilizer is associated with about 2.5% of greenhouse gas emissions on a global basis, about 1% for production and 1.5% arising from use. Some estimates appear to state a total of 5% (Gao & Cabrera Serrenho, 2023), but half of that figure arises from manure.
In North America, manufacture and use of fertilizer accounts for an annual emission of approximately 179 million tons of carbon dioxide equivalents (CO2e) (Bruulsema et al., 2024). Reducing those emissions would comprise a substantial contribution toward mitigation, and at current carbon pricing, could be worth billions of dollars. The industry is exploring and applying innovations toward reducing emissions of GHGs arising from both the manufacture and use of fertilizers. Reductions in GHG emissions in both fertilizer manufacturing and use could all contribute to lower carbon intensity (CI )scores for growers. Both using a low-emission fertilizer and optimizing fertilizer applications may help to lower CI scores and open a potential avenue for premium crop prices for farmers.
Fertilizer manufacturing
On the manufacturing side, there has been considerable transition in the North American industry over the past few decades, as older facilities have been upgraded or shut down and newer facilities have come online. Most of these facilities continue to use natural gas and the Haber-Bosch process but with greater efficiency. Additionally, newer plants use a catalytic reduction technology to cut emissions of nitrous oxide (N2O) associated with making nitrate forms of fertilizer.
A recent benchmarking study by Fertilizer Canada (2023) reported total and net emission of 2.4 and 1.7 ton CO2e per ton of ammonia-N produced, respectively, for nine facilities in Canada during the period 2018–2020. The net emissions reflect CO2 that was recaptured and used in other processes, including urea manufacture.
Carbon intensity scores based on life-cycle analysis use emission factors from the Greenhouse Gases, Regulated Emissions, and Energy Use in Transportation (GREET) model (USDOE-OSTI, 2023). The GREET model is updated frequently by the Argonne National Laboratory for the U.S. Department of Energy. The 2023 version gives a figure for energy use for ammonia production that is 19% lower than in the 2007 version, reflecting the industry’s investment in newer and more efficient manufacturing technology. The estimated GHGs emitted in ammonia production amount to 2.3 tons of CO2e per ton of N supplied in the product, 12% less than in 2007. The emission factor for ammonium nitrate has been reduced even more, owing to an 80% reduction in N2O emissions associated with the manufacture of its nitrate component.
Fertilizer production projects
As of September 2024, 236 projects around the world have announced plans to produce low-carbon ammonia, spurred by anticipation of its use as a low-carbon fuel. The total production capacity of these announced projects would amount to 139 million tons per year of N in the form of ammonia (Green Markets, Sept. 6, 2024)—an amount exceeding what is currently used to produce fertilizer. Green and blue ammonia comprised 98 and 41 million tons, respectively. Of course, many announced projects will never materialize, but the flow of investment dollars to these efforts is substantial. Some aim to begin production as early as the end of 2026 with full production by 2030. The challenge in establishing such facilities, however, is substantial. Large production facilities require round-the-clock carbon-free energy and depend on electricity generated from wind turbines, solar panels, or hydropower.
Both Nutrien and CF Industries have stated plans to expand N2O emissions abatement efforts further at their current facilities. This is particularly important for nitrate-containing fertilizers, including urea ammonium nitrate (UAN). Investments in production of green ammonia (made using zero-carbon energy sources such as electricity or hydrogen) and blue ammonia (made using capture and storage of the carbon emitted by the Haber-Bosch process) have been substantial with several million tons of production expected within a few years.
As of Dec. 31, 2023, Nutrien has an annual production capability for 1.3 million tons of low-carbon (blue) ammonia at its N fertilizer facilities in Alberta and Louisiana (Nutrien Sustainability Report, 2023). It has previously announced goals to reduce emissions intensity (per ton of fertilizer produced) by 30% by 2030, relative to a 2018 baseline. Similarly, CF Industries has set goals to reduce its production emissions intensity by 25% by 2030, relative to a 2015 baseline, and reduce its Scope 3 emissions by 10% over the period 2020 to 2030.
In addition to large-scale production, several pilot facilities for production of green ammonia have also been developed at a small scale. One large advantage of small-scale decentralized production is much lower dependency on transport infrastructure and global supply chains.
The Kenya Nut Company has deployed a decentralized green ammonia production unit in Naivasha, Kenya, according to the website of Talus (2023). The unit includes a 2.1-MW solar farm and produces about 1 ton of green ammonia per day. Talus is also working with Landus, an Iowa-based diversified farmer-owned agricultural cooperative, on its first U.S.-based commercial green ammonia installation. Talus has also announced a working agreement with Minbos to establish production of various fertilizer forms from green ammonia in Angola.
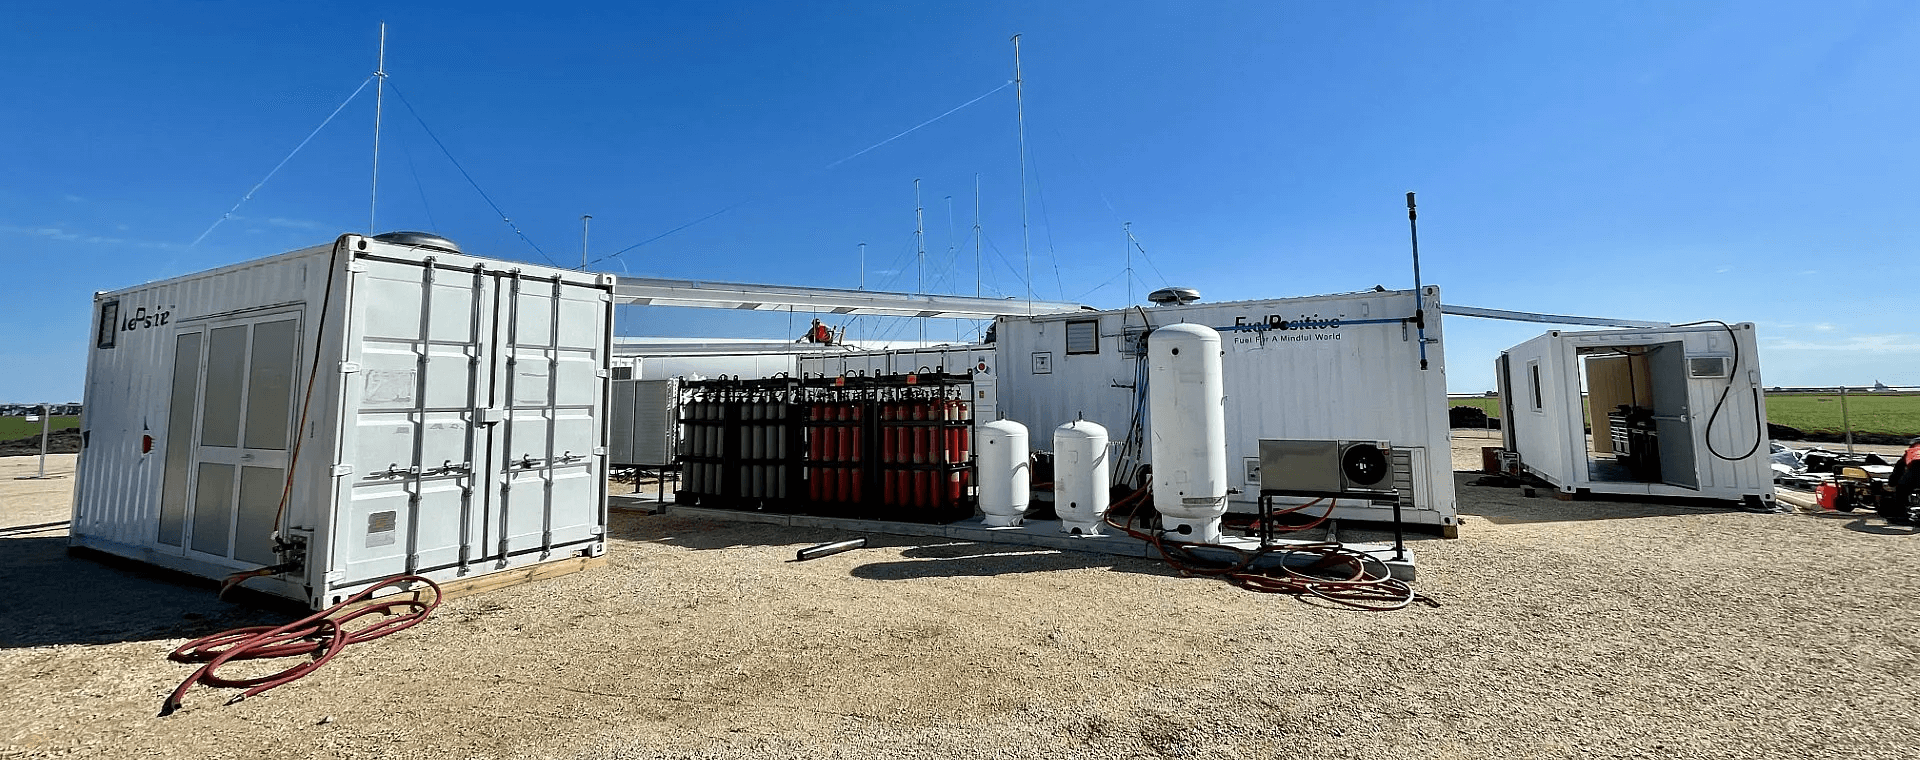
FuelPositive, a company based in Waterloo, ON, Canada has installed a pilot green ammonia production system on a farm in the province of Manitoba. It uses a 1-MW solar panel array, occupying 1.5 acres, to produce about 90 tons per year of N in the form of anhydrous ammonia.
The agtech start-up Nitricity in San Francisco, CA, is developing regionalized, distributor-level production of nitrate fertilizers using air, water, and plasma from renewable electricity. It announced in 2022 that it will collaborate with the International Fertilizer Development Center (IFDC) on the launch of a demonstration system at IFDC’s research facility in Muscle Shoals, AL. In 2023, Chipotle announced it will invest in Nitricity, providing funds toscale up its renewable N production at point-of-use, build out company infrastructure, and support the launch of its first commercial product within the next two years (Green Markets, Dec. 15, 2023).
Fertilizer use
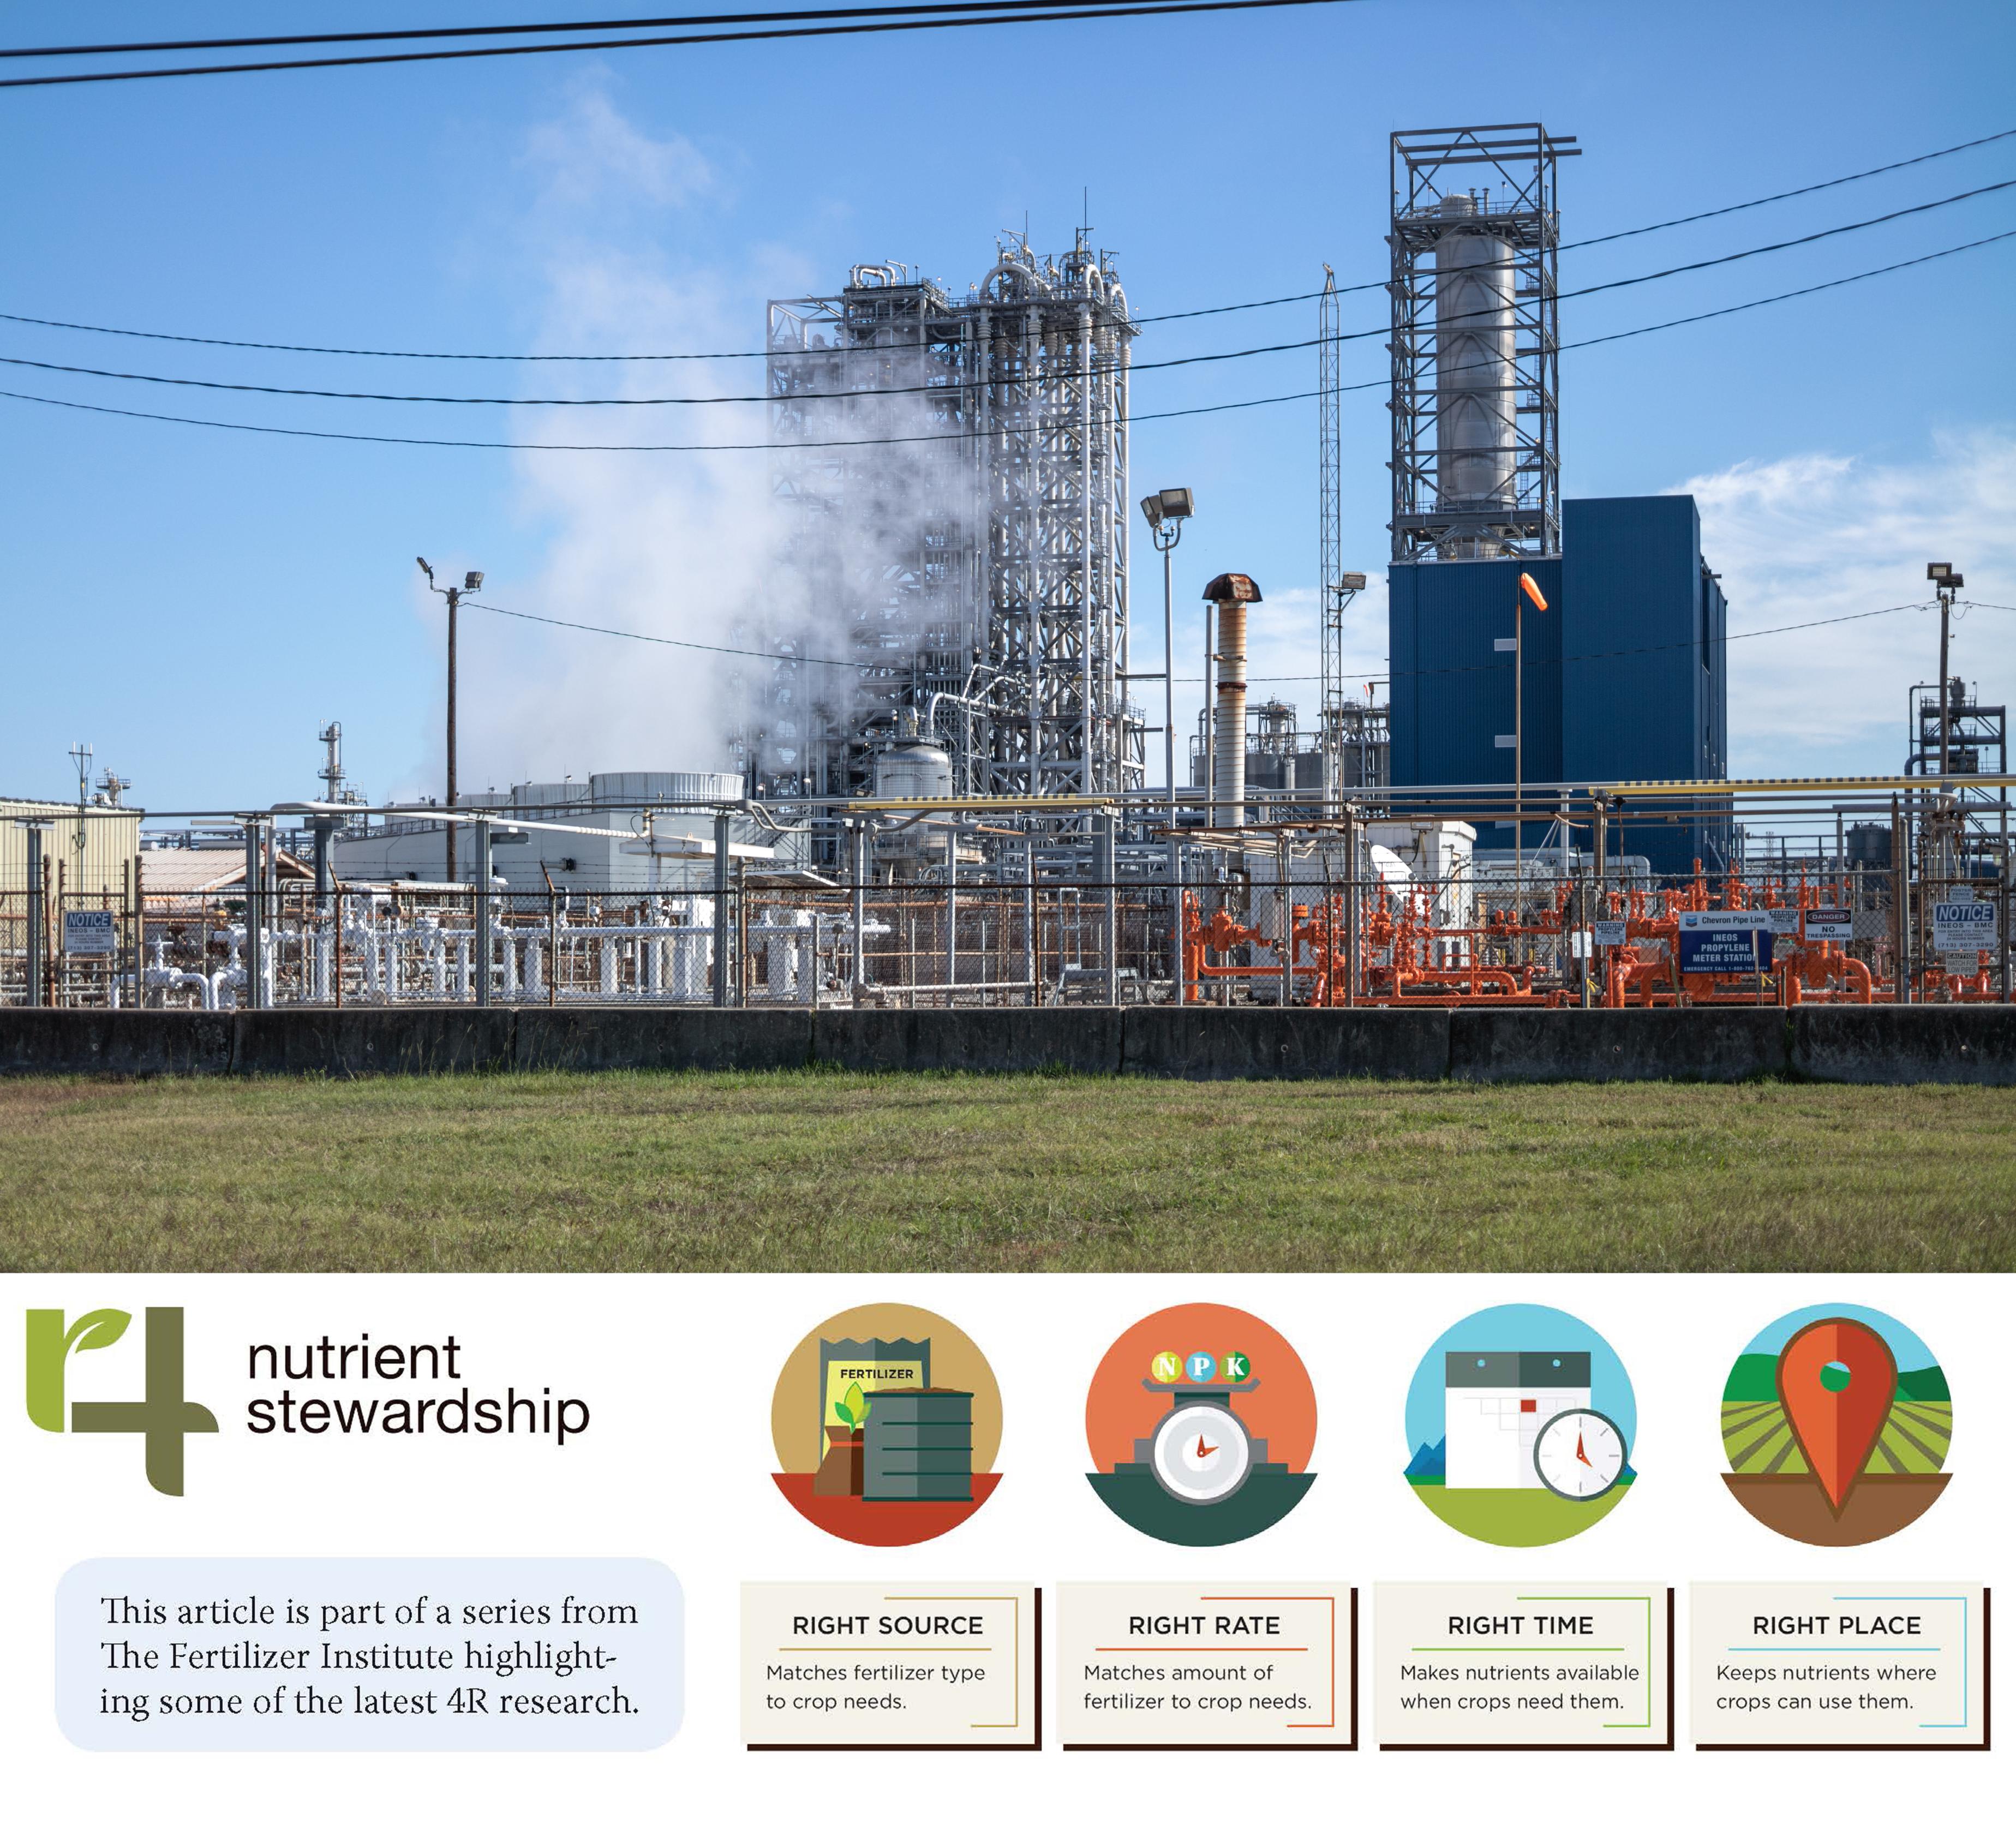
On the use side, efforts at promoting 4R Nutrient Stewardship have focused attention on improving N use efficiency and use of specific forms of fertilizer or nitrification inhibitors to reduce emissions of N2O from the soil.
Nitrous oxide emission results from the microbial processes of nitrification and denitrification and is regulated by soil and weather conditions. These conditions vary widely across the field and from hour to hour, resulting in emissions that have been characterized as occurring in “hot spots” and at “hot moments” (Wagner-Riddle et al., 2020). This means a large percentage of emissions can originate from brief, unpredictable events or from small areas in a field. The amount emitted is driven by soil and climatic factors and their interaction with crop nutrition and agronomic management practices.
Despite the variability in soil N2O emissions, a range of interventions have been shown to reduce emissions, including novel fertilizer products and improved agronomic practices. The four “rights” (source, rate, time, and place) of 4R nutrient stewardship remain the cornerstone to both optimizing nutrient use efficiency and reducing emissions in the field. In 2022, scientists recommended that under responsible plant nutrition, 4R principles should include fertilizer sources that are “climate-smart,” considering their carbon footprint, including emissions associated with both their manufacture and use (SPRPN, 2022).
To address the wide variability in measured responses to 4R practices, meta-analyses are applied to multiple site-years of research measurements across a wide range of conditions. A summary of the reductions in direct N2O emissions and increases in crop yield for each of the 4Rs is presented in Table 1. The values presented are global averages and may differ from those in specific regional cropping systems. The effects of timing and placement of N fertilizer are usually small and less consistent than those of enhanced-efficiency sources. For the practice of optimal placement, Young et al (2021) reported overall 15 and 43% reductions in N2O and NH3 emissions, respectively, and a 6% yield increase, in a synthesis of 113 studies. On average, timing had no consistent effect on N2O emission though it reduced NH3 emissions by more than 30%.
Inhibitors
Most meta-analyses confirm a strong summary effect of inhibitors—or the class of N fertilizers termed enhanced-efficiency (EEF)—on N2O emissions. Consistent emission reductions average 35% across 608 peer-reviewed studies worldwide, but types of EEF differ in efficacy (Table 1). These reductions in N2O emissions are larger than the effects on crop yield. Combining urease and nitrification inhibitors is generally recommended to avoid pollution swapping—lower N2O emission at the expense of higher ammonia emission or higher N2O emission if urease inhibitors are used to reduce ammonia losses without adjusting rates.
Table 1. Estimates of the average decrease in N2O emissions and increase in crop yield due to 4R N management practices according to meta-analyses summarizing the global literature.
| Practice | N2O emission, | Crop yield, percent increase | Source |
| ─────── % ─────── |
| |
| Fertilizer rate | 9 | -4 | Young et al, 2021 |
| Fertilizer timing | 0 | 4 | |
| Fertilizer placement | 14 | 5 | |
| Enhanced-efficiency fertilizer (EEF) source | 35 | 6 | |
| EEF on maize | 25 | 4 | Yao et al, 2024 |
| EEF on wheat | 29 | 5 | |
| EEF on rice | 25 | 8 | |
| Nitrification inhibitors (NI) | 44–49 | 2–5 | Fan et al., 2022; Grados et al., 2022; |
| Urease inhibitors + NI | 31–49 | 1–3 | |
| Controlled-release fertilizer source | 19–33 | –3 | |
Owing to variability in their economic benefit to farmers, inhibitor and EEF adoption can widely vary but does not yet cover more than 30% of the fertilizer N applied. Societal benefits in terms of reduced N losses, however, justify more widespread adoption (Lam et al., 2022). In general, efficacy of inhibitors is affected by their limited stability and volatility in different soils. Three main chemistries of nitrification inhibitors have been available for many years: nitrapyrin, dicyandiamide (DCD), and DMPP (3,4-dimethylpyrazole phosphate). Additionally, a new inhibitor chemistry, pronitridine, has more recently been developed. Recent work has also shown promise for a new class of inhibitors: the 1,2,3-triazoles (Taggert et al., 2021).
As concerns for plastic use in agriculture rises, emerging standards for biodegradability will affect the market for polymer-coated fertilizers. New approaches to the design of EEFs include the use of engineered, biodegradable coatings that respond to signaling molecules in the plant rhizosphere (Lam et al., 2022).
Rate reduction
The simplest logic for N2O reduction is through lower N fertilizer rates. Rate of N fertilizer applied is used in national greenhouse gas inventories to estimate N2O emissions for the Intergovernmental Panel on Climate Change (IPCC). The simplest IPCC Tier 1 approach assumes a fertilizer-induced emission factor (EF) of 1%, that is, for every 100 kg N applied, 1 kg of N2O-N is emitted. The general assumption is that EFs do not vary with rate. However, Shcherbak et al (2014) reviewed 233 site-years of studies with at least three N levels and found that N2O emission responded non-linearly to N rate. This implied that reducing rates in surplus to crop needs would be more effective in reducing emissions than reducing rates that were already close to optimum.
A global meta-analysis using more than 6,000 observations explored controlling factors of N2O emissions from maize, wheat, and rice (Yao et al., 2024). It showed that reducing N fertilizer rates significantly lowered N2O emissions. The study also found that corn and wheat yields declined only with large input rate reductions (Table 2). It should be noted, however, that their analysis included many studies where the average “full” rate of N fertilizer was rather high relative to the yield levels achieved. Fertilizer N rate reductions by more than 30% reduced corn yields considerably. When reducing rates from optimum rather than high levels, even by less than 30%, yield reductions can be expected to be larger.
Table 2. Summary of effects of reducing fertilizer N rates on N2O emissions and crop yields, calculated from global data provided in Yao et al. (2024).
| Crop and N application rate | Mean N rate | Emissions of N2O-N | Grain yield, bu/A |
| ─────── lb/ac ─────── | bu/ac | |
| Corn |
|
|
|
Full rate | 263 | 1.8 | 140 |
Reduced <30% | 175 | 1.3 | 139 |
Reduced 30-50% | 154 | 1.3 | 126 |
Reduced >50% | 88 | 0.9 | 98 |
| Wheat |
|
|
|
Full rate | 220 | 1.4 | 88 |
Reduced <30% | 166 | 1.2 | 90 |
Reduced 30-50% | 145 | 1.0 | 88 |
Reduced >50% | 100 | 0.9 | 86 |
Nitrogen use efficiency improvement

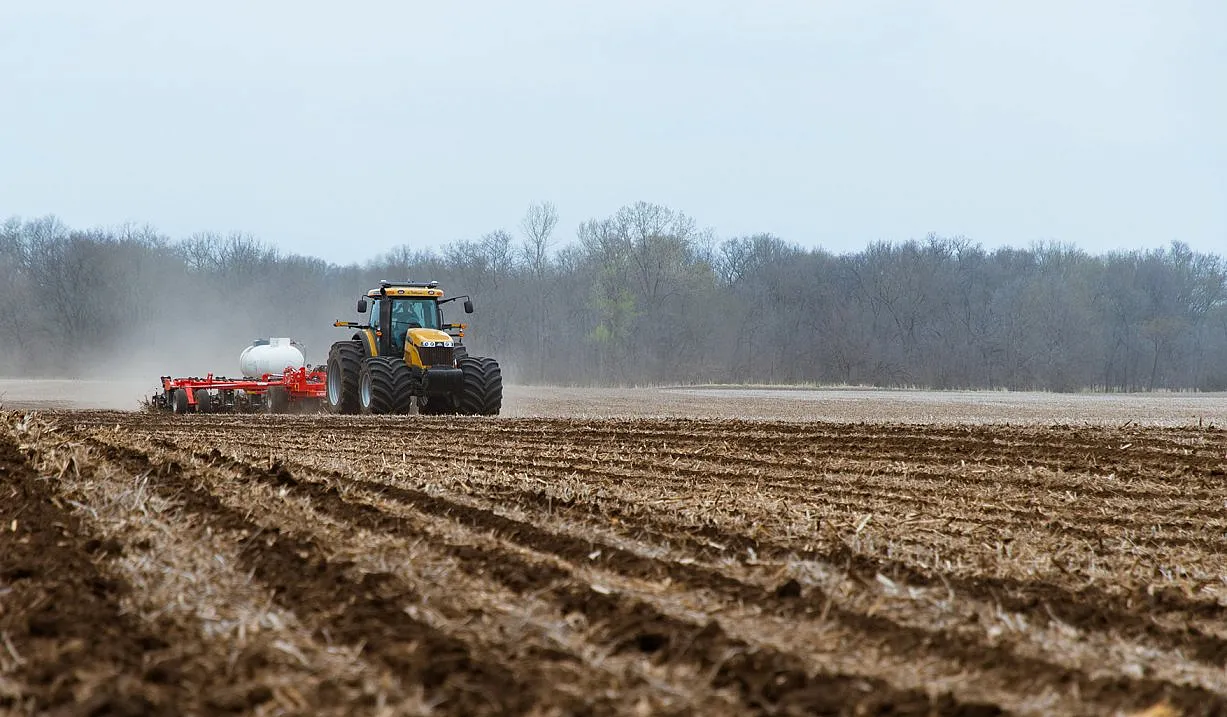
Since emissions of N2O from the field are generally considered to be proportional to the rate of fertilizer N applied, the opportunity to reduce application rates is often the first explored. Where N use efficiency is improved, more crop is produced per unit of fertilizer input, which can improve profitability to the farmer. Identifying opportunities to reduce rate without yield penalty, however, may require investments in sensing technology, more rigorous decision support, and changes to application timing and placement. Optimum rates vary from one year to another depending on weather since weather affects the crop’s demand for N, the mineralization of N from soil organic matter, and the loss processes of leaching and denitrification. There are, however, situations where N losses can be reduced through better management of timing and placement. For example, where urea N is applied to the soil surface, a substantial portion can be lost as ammonia volatilized to the air. On sandy soils, susceptible to nitrate leaching, split applications just in advance of crop uptake can minimize nitrate loss. Both ammonia and nitrate losses contribute to indirect emissions of N2O.
The industry has developed and promoted various tools to provide decision support to move application rates closer to optimum levels. By so doing, N losses and waste are reduced as are emissions of N2O. There is a limit, however, to improvement of N use efficiency, and generally optimum rates for cereals require rates that exceed crop removal to some extent. In many situations, the highest N use efficiency that can be maintained sustainably is 70 to 90%. Nitrous oxide emissions per unit of N applied are not assumed to change with N use efficiency in most Tier 1 and Tier 2 methodologies for national greenhouse gas inventories even though there is evidence that emissions increase exponentially with rate (Shcherbak et al., 2014).
The fertilizer industry has provided support starting decades ago for research linking specific 4R fertilizer practices to N2O emissions. Fertilizer research supported by the industry has led to meta-analyses summarizing the effects 4R on N2O (Eagle et al., 2017) as well as studies to help guide specific 4R practices for particular crops, regions, climates, and soils to best reduce N losses (O’Brien et al., 2022; Drury et al., 2024). In addition to research, the industry supports other programs to encourage the adoption of 4R nutrient stewardship, including the 4R acre reporting, 4R advocates, and 4R certification. These programs depend on retailers and growers to actively implement 4R practices to help reduce N losses. The province of Alberta has since 2010 recognized a Quantification Protocol for Nitrous Oxide Emissions (NERP) based on 4R nutrient management practices.
In addition, several companies in the industry have been developing programs to provide support for farmers to document and verify their sustainability. Regarding its Scope 3 emissions (those associated with the use of its products), Nutrien’s sustainability report notes: “In 2023, we successfully demonstrated proof of concept for verified and tradeable carbon outcomes. Our combined U.S. and Canada insets and offsets resulted in approximately 1,500 tonnes CO2e of emissions reductions and removals from improved agricultural practices.”
From production of fertilizer to use of fertilizer, the fertilizer industry continues to engage scientists, retailers, manufacturers, and growers to reduce the carbon footprint of fertilizer while still supporting a growing world with high-yielding crops.
References
Bruulsema, T., Ashford-Kornburger, D., Nigon, L., & Menheere, N. (2024). Getting support for adoption of climate-smart 4R practices. Crops & Soils, 57(2), 28–35. https://doi.org/10.1002/crso.20345
Drury, C.F., Agomoh, I.V., Yang, X., Phillips, L.A., Reynolds, W.D., Helmers, M.J., Calder, W., & Hedge, T. (2024). Stacking nitrogen management practices: Combining double-slot fertilizer injection with urease and nitrification inhibitors improves yields and reduces ammonia and nitrous oxide emissions. Soil Science Society of America Journal, 88, 1309–1323. https://doi.org/10.1002/saj2.20677
Eagle, A. J., Olander, L. P., Locklier, K. L., Heffernan, J. B., & Bernhardt, E. S. (2017). Fertilizer management and environmental factors drive N2O and NO3 losses in corn: A meta‐analysis. Soil Science Society of America Journal, 81, 1191–1202. https://doi.org/10.2136/sssaj2016.09.0281
Fan, D., He, W., Smith, W.N., Drury, C.F., Jiang, R., Grant, B.B., … & Zou, G. (2022). Global evaluation of inhibitor impacts on ammonia and nitrous oxide emissions from agricultural soils: A meta-analysis. Global Change Biology, 28(17), 5121–5141. https://doi.org/10.1111/gcb.16294.
Fertilizer Canada. (2023). Ammonia production greenhouse gas emissions benchmarking.https://fertilizercanada.ca/wp-content/uploads/2023/10/Nitrogen-Benchmarking-Report-Final.pdf
Foong, A., Pradhan, P., Frör, O., & Kropp, J.P. (2022). Adjusting agricultural emissions for trade matters for climate change mitigation. Nature Communications, 13(1), 3024. https://doi.org/10.1038/s41467-022-30607-x
Gao, Y., & Cabrera Serrenho, A. (2023). Greenhouse gas emissions from nitrogen fertilizers could be reduced by up to one-fifth of current levels by 2050 with combined interventions. Nature Food, 4(2),170–178. https://doi.org/10.1038/s43016-023-00698-w
Grados, D., Butterbach-Bahl, K., Chen, J., Groenigen, K.J.V., Olesen, J., van Groenigen, J.W., & Abalos, D. (2022). Synthesizing the evidence of nitrous oxide mitigation practices in agroecosystems. Environmental Research Letters, 17, 114024. https://doi.org/10.1088/1748-9326/ac9b50
IFA. (2022). Reducing emissions from fertilizer use. Report published by the International Fertilizer Association and SystemIQ. https://www.fertilizer.org/resource/reducing-emissions-from-fertilizer-use-report/
Kiel, J. (2023, November 2). Know your carbon intensity score. Ohio Farmer.https://www.farmprogress.com/conservation-and-sustainability/know-your-carbon-intensity-score
Lam, S.K., Wille, U., Hu, H.-W., Caruso, F., & Mumford, K. (2022). Next-generation enhanced-efficiency fertilizers for sustained food security. Nature Food, 3(8), 575–580. https://doi.org/10.1038/s43016-022-00542-7
O’Brien, P. L., Emmett, B. D., Malone, R. W., Nunes, M. R., Kovar, J. L., Kaspar, T. C., Moorman, T. B., Jaynes, D. B., & Parkin, T. B. (2022). Nitrate losses and nitrous oxide emissions under contrasting tillage and cover crop management. Journal of Environmental Quality, 51(4), 683–695. https://doi.org/10.1002/jeq2.20361
Shcherbak, I., Millar, N., & Robertson, G.P. (2014). Global meta-analysis of the nonlinear response of soil nitrous oxide emissions to fertilizer nitrogen. Proceedings of the National Academy of Sciences, 111(25), 9199–9204. https://doi.org/10.1073/pnas.1322434111
SPRPN. (2022). Furthering 4R nutrient stewardship (Issue Brief 03). Scientific Panel on Responsible Plant Nutrition. https://www.sprpn.org/post/furthering-4r-nutrient-stewardship
Taggert, B.I., Walker, C., Chen, D., & Wille, U. (2021). Substituted 1,2,3-triazoles: a new class of nitrification inhibitors. Scientific Reports, 11(1), 14980. https://doi.org/10.1038/s41598-021-94306-1
Talus (2023). Kenya Nut and Talus Renewables to manufacture sustainable fertilizer with hydrogen. https://www.talusag.com/blog/kenya-nut-and-talus-renewables-to-manufacture-sustainable-fertilizer-with-hydrogen
Thapa, R., Chatterjee, A., Awale, R., McGranahan, D.A., & Daigh, A. (2016). Effect of enhanced efficiency fertilizers on nitrous oxide emissions and crop yields: A meta-analysis. Soil Science Society of America Journal, 80(5), 1121–1134. https://doi.org/10.2136/sssaj2016.06.0179
USDOE-OSTI. (2023). R&D GREET 1 Series (Fuel-Cycle Model) 2023rev1. U.S. Department of Energy Office of Science and Technology Information. https://www.osti.gov/doecode/biblio/113174
Wagner-Riddle, C., Baggs, E.M., Clough, T.J., Fuchs, K., & Petersen, S.O. (2020). Mitigation of nitrous oxide emissions in the context of nitrogen loss reduction from agroecosystems: managing hot spots and hot moments. Current Opinion in Environmental Sustainability, 47, 46–53. https://doi.org/10.1016/j.cosust.2020.08.002
Yao, Z., Guo, H., Wang, Y., Zhan, Y., Zhang, T., Wang, R., Zheng, X., & Butterbach-Bahl, K. (2024). A global meta-analysis of yield-scaled N2O emissions and its mitigation efforts for maize, wheat, and rice. Global Change Biology, 30(2), e17177. https://doi.org/10.1111/gcb.17177
Young, M.D., Ros, G.H., & de Vries, W. (2021). Impacts of agronomic measures on crop, soil, and environmental indicators: A review and synthesis of meta-analysis. Agriculture, Ecosystems & Environment, 319, 107551. https://doi.org/10.1016/j.agee.2021.107551
Self-Study CEU Quiz
Earn 1 CEU in Nutrient Management by taking the quiz for the article at https://web.sciencesocieties.org/Learning-Center/Courses. For your convenience, the quiz is printed below. The CEU can be purchased individually, or you can access as part of your Online Classroom Subscription.
- For fertilizer producers, Scope 3 emissions include all greenhouse gas emissions that
- are derived from the Haber-Bosch Process.
- arise from fertilizer use.
- relate to electricity use.
- relate to use of natural gas.
- Globally, the percentage of total greenhouse gas emissions attributed to food systems is
- 10%.
- 13%.
- 31%.
- 49%.
- Globally, the percentage of total greenhouse gas emissions attributed to fertilizer use is
- 1%.
- 1.5%.
- 2.5%.
- 5%.
- To reduce the nitrous oxide emissions associated with the manufacture of nitrate fertilizers, the industry uses
- nitrification inhibitors.
- catalytic reduction technology.
- the Argonne National Laboratory.
- the Haber-Bosch process.
- Ammonia manufactured using zero-carbon energy sources such as renewable electricity is called
- grey ammonia.
- blue ammonia.
- green ammonia.
- brown ammonia.
- A major advantage of small-scale decentralized production of ammonia is
- lower dependency on transport infrastructure.
- higher production efficiency.
- lower losses of ammonia to air.
- lower cost.
- Of the four components of 4R Nutrient Stewardship, the greatest reductions in nitrous oxide emissions result from choice of fertilizer
- source.
- rate.
- time.
- place.
- In many situations, the highest nitrogen use efficiency range that can be realistically and sustainably maintained is
- 60-80%.
- 70-90%.
- 80-100%.
- 90-110%.
- According to a meta-analysis across more than 600 studies, use of an enhanced efficiency fertilizer (EEF) decreased nitrous oxide emissions, on average, by
- 14%.
- 35%.
- 42%.
- 56%.
- Nitrous oxide emissions are driven by soil and climatic factors and their interaction with agronomic management practices and
- pesticide management.
- microbiome management.
- crop nutrition.
- planting system.
Text © . The authors. CC BY-NC-ND 4.0. Except where otherwise noted, images are subject to copyright. Any reuse without express permission from the copyright owner is prohibited.