
Understanding the Mineral Nutrient Value of Wheat Residue


There is a substantial pool of mineral nutrients contained in wheat residue, concentrated in K, which has substantial economic value. Given this value, it is important for wheat producers to weigh the relative benefits of residue harvest, which gives immediate but marginal revenue gains, and residue retention, which has multifaceted benefits that include substantial savings on future nutrient costs. Persistent removal of nutrients from agronomic systems through residue harvest affects soil nutrient availability in the short- and long-term, and the timing and magnitude of these changes will depend on the cropping system and soil. Earn 1 CEU in Nutrient Management by reading the article and taking the quiz at https://web.sciencesocieties.org/Learning-Center/Courses
This article was prepared as a contribution of the Western Region Nutrient Management Coordinating Committee (WERA-103).
Wheat is the most widely produced food crop. It is grown on more than 540 million acres of land and provides about 20% of calories that people consume worldwide. Although wheat is produced foremost for grain, straw and other residues are a secondary by-product. After grain harvest, wheat growers have the choice to retain or remove residue from their fields. Residues are usually left in place in lower-yielding cropping systems, but it is increasingly common to harvest and sell residue from higher-yielding dryland and irrigated systems. This is primarily done for seedbed preparation of subsequent crops, as high-volume residue must be dealt with in some way, and it brings some immediate economic benefit to the farming operation. Selling residue is especially attractive when independent contractors provide full services—cutting, bailing, removal, and payment—with little to no input from producers.
However, many of the benefits of keeping residue in the cropping system are often not well understood or are undervalued by producers. Some of these benefits are soil erosion control, maintenance of soil organic matter, preservation of soil moisture, and recycling of mineral nutrients contained in residue. There has been little information available on the amount of nutrients in wheat residue and the economic value of residual nutrients in the western United States (Tarkalson et al., 2009); thus we recently conducted research on these topics. A full report of the research is available in the scientific literature (Adams et al., 2024), which follows similar research on barley (Rogers et al., 2024a, 2024b).
Our research utilized wheat variety trials in dryland and irrigated areas spread across six locations and two years in southern Idaho. Five classes of wheat were represented, and the trials ranged widely in grain yield and residue production. At harvest maturity, whole-plant samples were collected, and measurements were made of grain yield, residue biomass, and residue nutrient concentrations (N, P, K, Ca, Mg, S, Zn, and Mn). We estimated the economic value of select residual nutrients (N, P, K, and S) in terms of fertilizer replacement costs.
In brief, we found that there is a substantial pool of mineral nutrients contained in wheat residue, particularly K. But there are also non-trivial amounts of N and micronutrients that can have high replacement costs. The total residue biomass content of these nutrients is linearly related to the amount of residue produced, so the implications of harvesting residue becomes greater as the productivity and yield increase. In the following sections, we describe how residue nutrient content can be estimated for any wheat cropping system, more fully discuss our residue nutrient results, and present economic analysis.
Estimating Residual Nutrients
It is rare for wheat producers to make their own measurements of residue nutrient content in their cropping systems. This would involve making measurements of the amount of residue biomass produced and determining the concentrations of nutrients contained therein. On the other hand, grain yield is commonly measured. Using the collected dataset and relationships developed, residue nutrient content can be estimated from grain yield. In the following subsections, two approaches for doing this—a one-step approach and a two-step approach—are described.
The One-Step Approach
Figure 1 illustrates the relationships we observed between grain yield and residue content of eight mineral nutrients in our research. The straight black lines running through the data represent the results of linear regression analysis. There is substantial variability in nutrient contents around the regression lines, but the analysis shows the general trend by which residue nutrient content increases with increasing grain yield. This upward trend is primarily driven by increased residue production, rather than changes in residue nutrient concentrations. The regression equation is y = m*x, where the x variable is grain yield in bushels per acre, the y variable is residue nutrient content in pounds per acre, and m is the slope of the relationship between these parameters. Table 1 gives the slope value for each nutrient. Using the one-step procedure to estimate residue nutrient content in your own system, individual slope values are thus multiplied by your own grain yield data. For example, if your system had a grain yield of 80 bu/ac and you wanted to estimate the content of K in the residue, the equation would look like this (see Table 1 for coefficient values): y = m*x → y = 1.70*80 → y = 136 lb K/ac.
| Table 1. Linear regression coefficients (slope values) used to estimate residue nutrient contents (total uptake) using just grain yield information. | ||
| Independent variable | Dependent variable | m |
| (x variable) | (y variable) | (slope) |
| Grain yield (bu/ac) | Residue N (lb/ac) | 0.337 |
| Grain yield (bu/ac) | Residue P (lb/ac) | 0.0243 |
| Grain yield (bu/ac) | Residue K (lb/ac) | 1.70 |
| Grain yield (bu/ac) | Residue Ca (lb/ac) | 0.228 |
| Grain yield (bu/ac) | Residue Mg (lb/ac) | 0.0701 |
| Grain yield (bu/ac) | Residue S (lb/ac) | 0.0984 |
| Grain yield (bu/ac) | Residue Mn (lb/ac) | 0.00161 |
| Grain yield (bu/ac) | Residue Zn (lb/ac) | 0.000216 |
The Two-Step Approach
There is an alternative two-step approach that offers greater flexibility to adapt the estimates to your own circumstances. In this case, an estimate is made of residue production, and then it is multiplied by an estimate of residue nutrient concentration for any nutrient of interest.
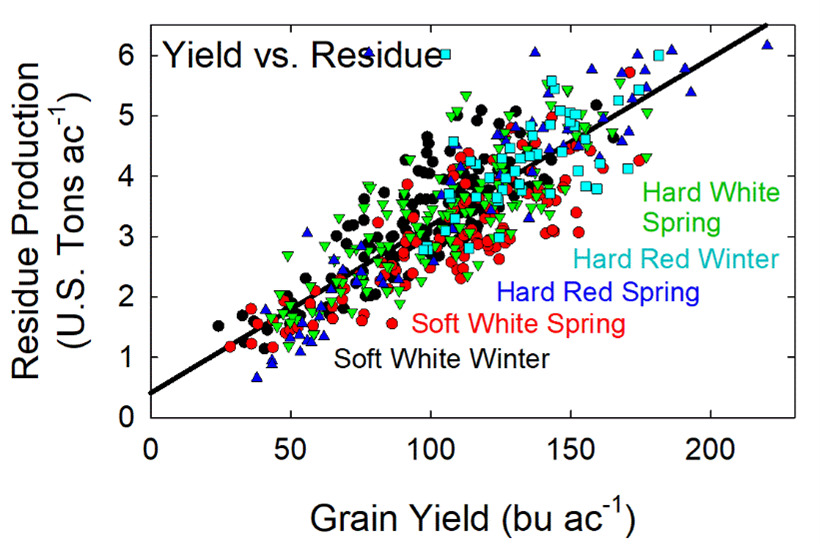
First an estimate of residue biomass production is needed. Figure 2 shows the relationship between grain yield and residue production from our study in southern Idaho. The linear regression coefficients (slope and y-intercept) for this relationship, which allow estimation of residue production when used with grain yield data, are given in Table 2. The regression equation in this case is y = m*x + b, where the x variable is grain yield in bushels per acre, the y variable is residue production (biomass) in tons per acre, m is the slope of the relationship between these parameters, and b is the y-intercept. As an example, if your cropping system had a grain yield of 80 bu/ac, estimating the residue production would be calculated as follows (see Table 2 for coefficient values): y = m*x + b → y = (0.0278*80) + 0.408 → y = 2.6 tons residue/ac. Another approach to estimate residue production is through harvest index (HI). If you know your grain yield, and you have an indication of what the HI typically is in your environment, then residue production could be estimated as follows: [(1 – HI)/HI]*grain yield. Please note that HI should be in decimal form (i.e., 0.48), not a percentage. In our southern Idaho study, average harvest index varied from about 0.46 in lower-yielding conditions up to 0.51 in higher-yielding conditions.
| Table 2. Linear regression coefficients (slope and y-intercept values) used to estimate residue biomass production using grain yield information. | |||
| Independent variable | Dependent variable | m | b |
| (x variable) | (y variable) | (slope) | (y-intercept) |
| Grain yield (bu/ac) | Residue biomass (tons/ac) | 0.0278 | 0.408 |
Next, an estimate of residue nutrient concentration is needed. Table 3 gives residue nutrient concentration information from the southern Idaho study, including indicators of variation in the data. This study included a great deal of diversity in locations, seasons, wheat classes, wheat varieties, grain yield, and residue production. These factors contributed to the variation observed in residue nutrient concentrations. But notably, southern Idaho crop production is largely concentrated in higher-yielding areas with adequate soil nutrient availability and irrigation, so the data are not representative of all wheat cropping systems. When choosing residue nutrient concentrations in making your own estimates, the values in Table 3 can provide guidelines, and adjustments can be made based on your own knowledge of your soil. For example, if you know your soil has very low levels of a particular nutrient, the Q1 value or even a lower value might be used.
| Table 3. Residue nutrient concentration data from research conducted in southern Idaho. This gives an indication of the spread or variation in the data by providing nutrient concentrations for Q1 (first quartile or 25th percentile), median, and Q3 (third quartile or 75th percentile). | |||
| Nutrient | Q1 | Median | Q3 |
| N | 7.74 | 10.2 | 13.6 |
| P | 0.420 | 0.620 | 0.938 |
| K | 43.6 | 53.8 | 65.2 |
| Ca | 6.14 | 7.20 | 8.44 |
| Mg | 1.56 | 2.10 | 2.64 |
| S | 2.46 | 3.24 | 3.92 |
| Zn | 0.0070 | 0.0129 | 0.0274 |
| Mn | 0.0274 | 0.0472 | 0.0736 |
With these pieces of information, you can now estimate residue nutrient content using the two-step approach. In the example above, we assumed a grain yield of 80 bu/ac and calculated an estimated residue production value of 2.6 tons/ac. Let’s say that we are interested in residue K, and we assume the median residue K concentration (53.8 lb K/ton residue) from this study. We can estimate residue K content as follows: (2.6 tons residue/ac)*(53.8 lb K/ton residue) = 140 lb K/ac. This closely compares to the 136 lb K/ac estimated using the one-step approach. If, for example, we knew that our soil had low K availability, we could assume the Q1 residue K concentration and make our estimate as follows: (2.6 tons residue/ac)*(43.6 lb K/lb residue) = 113 lb K/ac.
Key Takeaways From the Southern Idaho Residue Nutrient Data
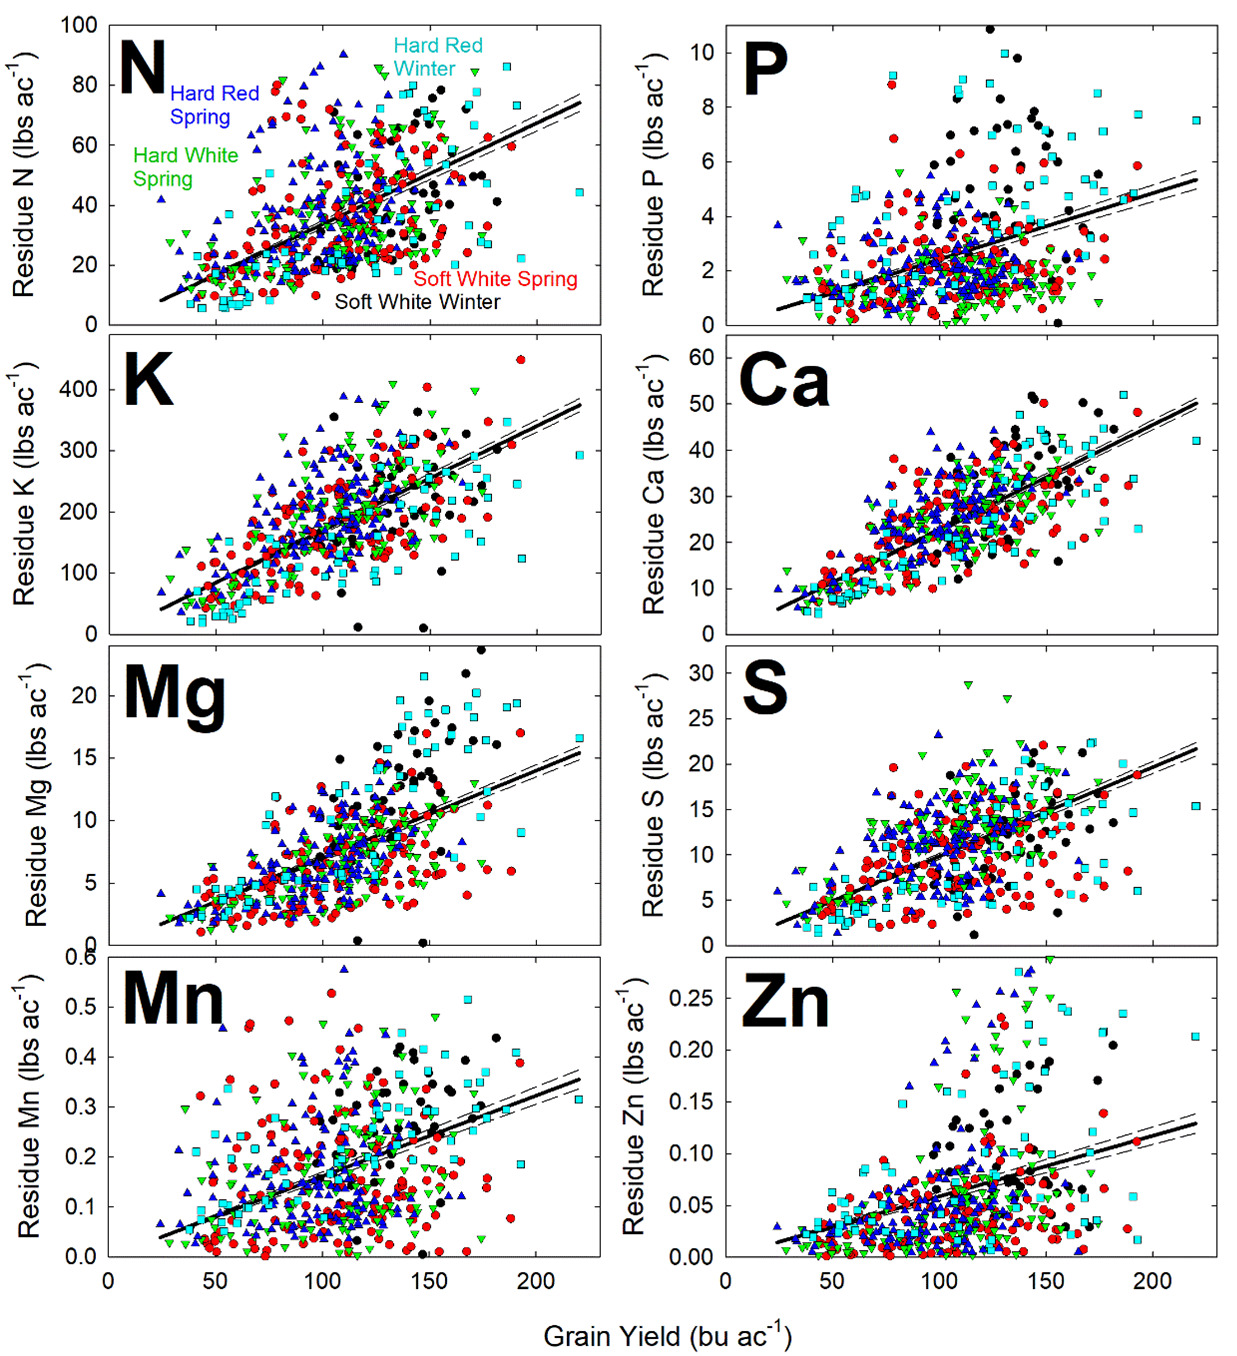
The data from Southern Idaho, best illustrated in Figure 1, show that wheat residue has especially high levels of K. Using the K equation given in Table 1, between 40 and 160 bu/ac grain yield, average residue K content would range from about 68 to 272 lb K/ac. This represents very substantial nutrient removal, particularly in higher-yielding cropping systems. Some soils have high native levels of K, including soils in southern Idaho, that will support high rates of crop K removal. However, with persistent removal, K will increasingly become limiting to crop growth and require replacement. Declines in the level of plant-available K in Idaho soils have been documented, for example. Wheat residue also contains a good deal of N, secondary macronutrients, and micronutrients (e.g., with grain yields ranging from 40 to 160 bu/ac, the average residue N content would vary from about 13 to 54 lb/ac). This is important to consider since N and several micronutrients can have high costs when they are applied as fertilizers.
Economic Analysis
In conducting economic analysis, the two-step approach was used to estimate average residue N, P, K, and S contents at four discrete grain yield levels, as shown in Table 4. If wheat residue was to be harvested containing these nutrients, Table 5 gives historical (2001 to 2019) low, average, and high fertilizer prices (in U.S. dollars per pound) required to replace them. Overall, fertilizer prices were the greatest for N. Notably, the cost of K fertilizer ranged the most widely with the historic high price for K being close to the historic high for N. The residue nutrient content data and fertilizer nutrient cost data were used to estimate residue N, P, K, and S replacement costs (U.S. dollars per acre) from 40 to 160 bu/ac yields as shown in Table 6. Owing to the high concentration of K in wheat residue and its relatively high fertilizer price, the replacement cost for K was especially substantial. With grain yields ranging from 40 to 160 bu/ac and average fertilizer prices, the K replacement cost ranged from $23 to $74/ac. Under a scenario of high fertilizer prices and high yields, the K replacement cost reached up to $154/ac. The total average replacement cost for N, P, K, and S ranged from $31 to $100/ac with a high price/high yield scenario reaching up to $192/ac. It is important to clarify that the economic estimates do not include secondary macronutrients, like Ca and Mg, or micronutrients, like Mn and Zn, which can have high costs. The estimates also do not include the cost of harvesting residue containing nutrients nor the application cost of fertilizers to replace nutrients harvested in residue.
| Table 4. Average wheat residue nutrient content (total uptake) values, corresponding to a range of discrete grain yields. | ||||
Residue nutrient content | ||||
| Grain yield | N | P | K | S |
| bu/ac | ||||
| 40 | 15.5 | 0.94 | 81.6 | 4.91 |
| 80 | 26.8 | 1.63 | 141 | 8.50 |
| 120 | 38.1 | 2.31 | 201 | 12.1 |
| 160 | 49.4 | 3.00 | 260 | 15.7 |
| Table 5. Historic low, average, and high (from 2001 to 2019) market fertilizer prices for individual nutrients (bottom) should fertilizer need to be applied to replace nutrients removed through residue harvest. | ||||
Fertilizer nutrient prices | ||||
| Cost category | N | P | K | S |
| Low | 0.30 | 0.08 | 0.12 | 0.12 |
| Average | 0.45 | 0.16 | 0.29 | 0.18 |
| High | 0.68 | 0.25 | 0.59 | 0.25 |
| Table 6. Estimates of fertilizer replacement costs for N, P, K, and S contained in wheat residue, if residue were to be harvested and removed from the cropping system. Estimates are given at four discrete grain yield levels. The primary values were calculated using average residue nutrient contents and average historic fertilizer prices. The ranges below (in parentheses) were calculated using historic low and high fertilizer prices. | |||||
Residue nutrient replacement costs | |||||
| Grain yield | N | P | K | S | Total |
| bu/ac | |||||
| 40 | 7.01 | 0.15 | 23.31 | 0.89 | 31.37 |
| (4.63, 10.52) | (0.08, 0.23) | (9.99, 48.09) | (0.58, 1.23) | (15.27, 60.08) | |
| 80 | 12.14 | 0.27 | 40.34 | 1.54 | 54.29 |
| (8.01, 18.21) | (0.13, 0.41) | (17.29, 83.25) | (1.00, 2.12) | (26.44, 103.98) | |
| 120 | 17.27 | 0.38 | 57.38 | 2.19 | 77.22 |
| (11.40, 25.90) | (0.19, 0.58) | (24.59, 118.40) | (1.43, 3.02) | (37.60, 147.89) | |
| 160 | 22.39 | 0.49 | 74.41 | 2.85 | 100.14 |
| (14.78, 33.59) | (0.25, 0.75) | (31.89, 153.55) | (1.85, 3.91) | (48.76, 191.80) | |
Conclusions
There is a substantial pool of mineral nutrients contained in wheat residue, concentrated in K, which has substantial economic value. Given this value, it is important for wheat producers to weigh the relative benefits of residue harvest, which gives immediate but marginal revenue gains, and residue retention, which has multifaceted benefits that include substantial savings on future nutrient costs. Persistent removal of nutrients from agronomic systems through residue harvest affects soil nutrient availability in the short and long term, and the timing and magnitude of these changes will depend on the cropping system and soil.
References
Adams, C.B., Rogers, C.W., Marshall, J.M., Hatzenbuehler, P., Walsh, O.S., Thurgood, G., Dari, B., Loomis, G., & Tarkalson, D.D. (2024). Uptake and economic value of macro- and micronutrient minerals in wheat residue. Agronomy, 14(8), 1795.
Rogers, C.W., Adams, C.B., Marshall, J.M., Hatzenbuehler, P., Thurgood, G., Dari, B., Loomis, G., & Tarkalson, D.D. (2024a). Barley residue biomass, nutrient content, and relationships with grain yield. Crop Science, 64, 2345–2367.
Rogers, C.W., Adams, C.B., Tarkalson, D.D., Marshall, J.M., Hatzenbuehler, P., Thurgood, G., Dari, B., & Loomis, G. (2024b). Improving estimates for barley residue biomass, nutrients, and economic value. Crops & Soils, 57(4), 25–29.
Tarkalson, D.D., Brown, B., Kok, H., & Bjorneberg, D. L. (2009). Irrigated small-grain residue management effects on soil chemical and physical properties and nutrient cycling. Soil Science, 174, 303–311.
Self-Study CEU Quiz
Earn 1 CEU in Nutrient Management by taking the quiz for the article at https://web.sciencesocieties.org/Learning-Center/Courses. For your convenience, the quiz is printed below. The CEU can be purchased individually, or you can access as part of your Online Classroom Subscription.
- Approximately what percentage of human food calories does wheat provide worldwide?
- 2%.
- 12%.
- 20%.
- 35%.
- Why might a farmer harvest and sell wheat residue?
- Seedbed preparation for subsequent plantings.
- Field aesthetics
- Increase farm income.
- Both a and c.
- Why might a farmer retain wheat residue in the field?
- Erosion control.
- Recycling of mineral nutrients.
- Preservation of soil moisture.
- All the above.
- Of the parameters (measurements) below, which is/are used as a predictor in the one-step approach for estimating residue nutrient content?
- Residue biomass.
- Grain yield.
- Fertilizer application rate.
- Both a and c.
- The research described in this article was conducted in western Montana.
- True.
- False.
- What describes residue nutrient “concentration?”
- The weight of nutrient per unit yield.
- The weight of nutrient per acre of residue produced.
- The weight of nutrient per unit weight of residue.
- None of the above.
- What mineral nutrient is the most concentrated in wheat residue?
- N.
- K.
- Ca.
- Zn.
- If micronutrient mineral (e.g., Zn and Mn) levels in the soil decrease due to residue harvest and become limiting to ongoing crop growth, there is no need to worry because the cost of nutrient replacement fertilizers is low.
- True.
- False.
- Among the primary macronutrient minerals (N, P, K, and S) contained in wheat residue, which one has the highest overall fertilizer replacement price?
- N.
- P.
- K.
- S.
- Among the primary macronutrient minerals (N, P, K, and S) contained in wheat residue, which one has the highest overall fertilizer replacement cost?
- N.
- P.
- K.
- S.
Text © . The authors. CC BY-NC-ND 4.0. Except where otherwise noted, images are subject to copyright. Any reuse without express permission from the copyright owner is prohibited.