
Evaluation of Slope Position for Variable-Rate Fertilization in Southern Alberta


Soil properties and crop yield vary with slope position in hummocky landscapes. Slope position is also readily mapped and thus potentially useful for delineating management zones for variable-rate fertilization (VRF). Slope position was evaluated as a basis for VRF in southern Alberta, Canada. Earn 0.5 CEUs in Nutrient Management by reading the article and taking the quiz at
https://web.sciencesocieties.org/Learning-Center/Courses.
It is well established that soil properties and crop yield vary with slope position in hummocky landscapes. Slope position is also readily mapped and thus potentially useful for delineating management zones for variable-rate fertilization (VRF).
We conducted a study on four fields in southern Alberta, Canada to evaluate slope position as a basis for VRF (Table 1). Three dryland fields under long-term no-till management and one irrigated field under minimum-tillage management were included in the study. Trials were conducted on adjacent field areas of each field for three years. Elevation differences between upper and lower slope positions ranged from 3 to 15 ft. Growing season precipitation during the three years of the study ranged from 80 to 130% of normal. The trial areas were managed the same as the rest of the field, including crop cultivar and pest management.
Table 1. Crops and growing season precipitation in variable-rate fertilization trials conducted for three years in southern Alberta, Canada.
Location | ||||
|---|---|---|---|---|
| Year | Claresholm | Magrath | Raymond | Coaldale |
Crop Grown | ||||
| 2011 | Canola | Wheat | Canola | Wheat |
| 2012 | Wheat | Wheat | Durum | Wheat |
| 2013 | Wheat | Barley | Durum | Canola |
Precipitation (inches from May 1 to July 31) | ||||
| 2011 | 10.5 | 6.4 | 9.0 | 9.1 |
| 2012 | 8.0 | 7.8 | 9.8 | 10.1 |
| 2013 | 9.3 | 6.6 | 7.1 | 11.2 |
| Normal | 8.1 | 8.4 | 7.6 | Irrigated |
Eleven fertilizer treatments were applied with a small-plot seeder in non-replicated strips 7.5 ft in width down the length of each field, about 0.5 miles (Figure 1). All sites were direct-seeded with fertilizer side-banded. Fertilizer treatments included six N rates from 0 to 135 lb N/ac +22.5 lb P2O5/ac; Environmentally Smart Nitrogen (ESN) at 54 lb N/ac; –P at 54 lb N/ac; and +K, +KS, and +KSmicronutrients at 81 lb N/ac. The seeding unit was guided by a tractor equipped with autosteer using a real-time kinematic (RTK) GPS capable of sub-inch accuracy.
Soil and crop measurements were obtained at three to nine common benchmark locations along each transect that represented lower, mid-, and upper slope positions (Figure 2). Soil samples were obtained in late fall and analyzed for extractable nutrients and nutrient supply rate to Plant Root Simulator (PRS) probes in addition to pH, electrical conductivity (EC), sodium adsorption ratio (SAR), and organic matter concentration. Soil moisture to a depth of 3 ft was monitored through the growing season using neutron probe access tubes installed on fertilized guard plots located adjacent to benchmark plots. Benchmark plots were trimmed to a length of 33 ft and harvested with a small-plot combine.
Slope Position | ||||
|---|---|---|---|---|
| Lower | Mid | Upper | P | |
Soil Chemical Properties | ||||
| Organic matter to 6 inches (%) | 4.5a | 4.3a | 3.8b | *** |
| pH to 6 inches | 6.6b | 6.8b | 7.3a | *** |
| Electrical conductivity to 24 inches (dS/cm) | 1.9a | 0.9b | 0.6b | *** |
| Sodium adsorption ratio (SAR) to 24 inches | *** | |||
Extractable soil nutrients (lb/ac) | ||||
| NO3–N to 24 inches | 19a | 13ab | 12b | ** |
| P to 6 inches | 55a | 41b | 27c | *** |
| K to 6 inches | 995a | 708b | 585b | *** |
| SO4–S to 12 inches | 218a | 54b | 48b | *** |
Soil nutrient supply (mg/m2/d, PRS probes) | ||||
| NO3–N | 48 | 37 | 26 | ** |
| P | 5.9 | 6.1 | 4.0 | ns† |
| K | 131a | 82b | 57b | *** |
| S | 94a | 41b | 18b | *** |
***P<0.001, **P<0.01, *P<0.05,† ns, P>0.05.
Soil properties were strongly influenced by slope position (Table 2). Upper slope positions had less organic matter and were more alkaline than mid- and lower slope positions while lower slope positions were more saline and sodic than mid- and upper slope positions. Soil nutrients were consistently higher at lower slope positions and lower at upper slope positions, with consistent differences among years and locations, although the magnitude and relative differences among slope positions varied. Differences were attributable to topographic processes controlling the movement and bioavailability of nutrients. Based on soil nutrient measurements at midslope benchmarks, fertilization with N and P would be recommended at all sites, but fertilization with K, S, and micronutrients would not be.
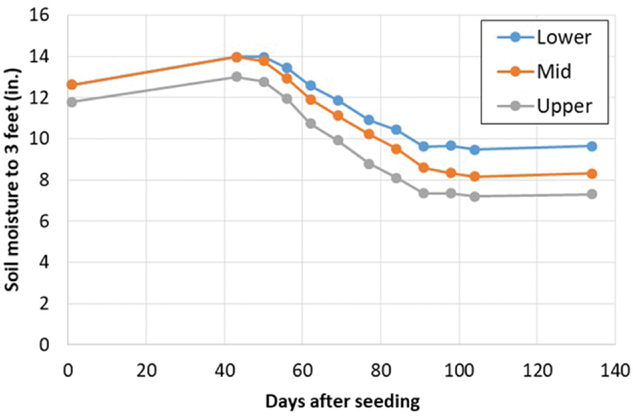
Lower slope positions had more soil moisture at seeding than upper slope positions by an average of 1.6 inches (data not shown). However, as illustrated in Figure 3 for the dryland Magrath location, soil moisture often changed in parallel over the growing season. The similarity in the pattern of soil moisture change among slope positions was attributed to low runoff and accumulation of runoff in depressions during the few precipitation events that resulted in runoff. Over all trials, depletion of soil moisture over the growing season was actually 0.9 inches greater at upper than lower slope positions (P=0.10), due primarily to greater depletion of soil moisture below 1 ft. Elevated soil salinity and excessive moisture may have limited the potential for crops to utilize soil moisture at lower slope positions.

Crop yields were only influenced by slope position in two trials (Figure 4). On average, crop yields at mid- and upper slope positions were 96 and 86%, respectively, of those at lower slope positions.
Crop yields were influenced (P<0.01) by N fertilizer rate in all trials of this study (Figure 3). However, the interaction of N fertilizer rate and slope position was only significant (P=0.05) at Raymond and Coaldale in 2012 where yield gains were smaller at the lower than the upper slope position. In most cases, the relationship of crop yield to N fertilizer rate was similar among slope positions.
Other fertilizer treatments did not strongly influence crop yields. Inclusion or exclusion of P, K, S, or micronutrients influenced crop yields in 4 of the 12 trials with maximum yield impact of 15% and no interaction with slope position.
For VRF to be profitable, optimum fertilizer rates must vary consistently or predictably within a field. In this study, soil properties varied consistently among slope positions, but optimum fertilizer rates were not consistently or appreciably different among slope positions. We compared net returns for each field based on fertilizer recommendations for the midslope position vs. each slope position separately. Recommendations were obtained using CropCaster, a validated model using PRS probe measurements, and AFFIRM, a stochastic model developed for Alberta for extractable soil nutrient measurements. Fertilizer rates based on each slope position did not increase net return to fertilizer for either recommendation system, even without accounting for the increased costs of implementing VRF. Even assuming perfect foreknowledge, applying the optimum fertilizer rates based on the midslope position only reduced net return by $4/ac compared with optimum application for each slope position. Crop yield response to fertilizer rate did not vary sufficiently to warrant adoption of VRF based on slope position in this region.
Several factors contributed to the limited benefit of VRF based on slope position in this region despite variation in soil properties. With the exception of N, soil nutrient bioavailability was often sufficient for maximum crop yield at all slope positions. Spatial autocorrelation of soil nutrient supply with crop nutrient requirements reduced variation in optimum fertilizer rates. Fertilizer responses were also influenced by weather conditions as much or more than soil properties, e.g., P fertilizer benefits increased due to dry soil and cool temperatures after seeding. Finally, soil moisture availability was not appreciably different among slope positions, thus limiting yield differences. Depressions were not included as a landscape unit in our study, but several benchmarks at the lower slope position were lost due to flooding, highlighting the usefulness of precision technology to avoid fertilizer application to depressions. Some depressions may be cropped in dry years, but fertilizer addition will likely not be required due to elevated nutrient bioavailability.
Regions and landscapes with more extreme moisture redistribution or nutrient bioavailability may obtain greater benefit from VRF than observed in our study. Due to the complexity of cropping systems, validation of the approach used for VRF should be conducted. Spatial autocorrelation of soil nutrient supply with crop nutrient demand may often limit variation in fertilizer requirement. Inclusion of a single strip with suboptimal N rate would have been sufficient to evaluate if N fertilizer response varied consistently or predictably among slope position in our study but would still have required evaluation over multiple fields and years.
WERA-103
This article was prepared as a contribution of the Western Region Nutrient Management Coordinating Committee (WERA-103).
Self-Study CEU Quiz
Earn 0.5 CEUs in Nutrient Management by taking the quiz for the article at https://web.sciencesocieties.org/Learning-Center/Courses. For your convenience, the quiz is printed below. The CEU can be purchased individually, or you can access as part of your Online Classroom Subscription.
- Varying of fertilizer rate within a field is profitable when
- crop yields vary within a field.
- crop yield benefits from fertilizer vary within a field.
- soil tests vary within a field.
- All of the above.
- Which of the following is the landscape unit in southern Alberta in which fertilizer rates could be reduced?
- Upper slope positions.
- Midslope positions.
- Lower slope positions.
- Depressions.
- Differences in soil nutrient bioavailability among field management zones will not impact economic optimum fertilizer rate if
- soil nutrient bioavailability is sufficient for maximum crop yield in all field management zones.
- soil nutrient bioavailability is positively correlated with crop nutrient requirement (i.e., management zones with higher soil nutrient bioavailability have higher crop nutrient requirements).
- weather conditions control economic optimum fertilizer rate rather than soil nutrient bioavailability.
- All of the above.
- Crops were more effective at utilizing soil moisture at upper than lower slope positions in this study because
- soil moisture was greater at upper slope positions.
- soil salinity was elevated at upper slope positions.
- subsoil moisture was present and required by crops at upper slope positions.
- runoff increased soil moisture availability at upper slope positions.
- Validation of variable-rate fertilization requires
- grid soil sampling.
- yield maps.
- repeated measurements of expected vs. actual fertilizer benefit among crop management zones.
- real-time kinematic (RTK) GPS.
Text © . The authors. CC BY-NC-ND 4.0. Except where otherwise noted, images are subject to copyright. Any reuse without express permission from the copyright owner is prohibited.